
Let’s talk latency
Trading is a highly competitive business where speed is of the essence. There are several different ways to measure speed, but for electronic trading systems one of the most important is latency.
Latency simply means the time elapsed between one event and another. For example, the time it takes to receive the latest price of a security, or for an order to be received and acknowledged by an ECN. In manual trading latency was measured in minutes or even hours, but in e-trading it’s measured in milliseconds or microseconds. This makes performance a primary concern. To stay competitive, we need to manage latency scientifically.
In decision-making, knowing the age of data determines our strategy and affects our confidence in the expected results of the decision. An e-trading system doesn’t only need to be fast – it needs to be predictably fast.
When we collect and measure latencies, the first result we get is a long list of timestamped events. That’s not very helpful. To gain useful insights from the data, we need to aggregate it. There are many ways to aggregate data, but for latencies the most effective method is data distribution. That is, distributing the values according to their frequency. We can divide the domain of the latencies into intervals or buckets, then count how many times each measure falls into each interval.
Despite its simplicity, this distribution provides a lot of useful information. For example, we can determine the probability that an event will experience a certain delay. Or better, the probability that the event will experience a delay of less than a given threshold.
A typical way to show latencies is using percentiles. For example, 99.999% of the events are delivered within 10 ms, or 97% of round-trip times in the order management system are within 15 ms.
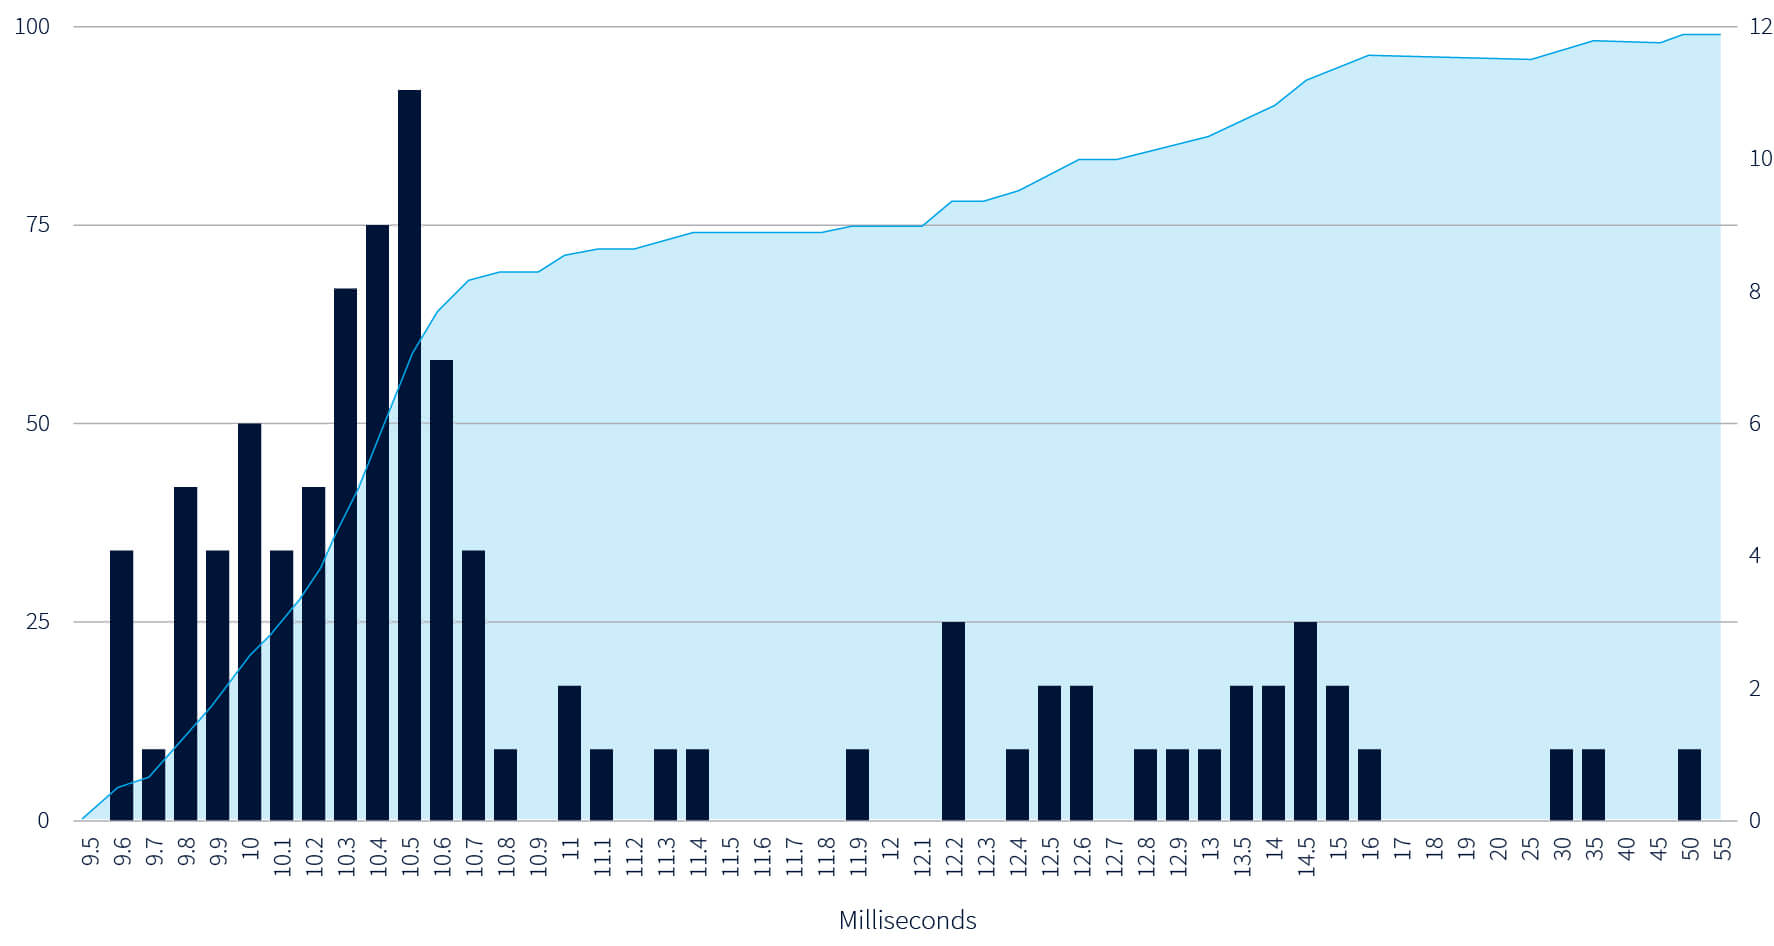
Often, the distribution is concentrated around one value. For example, in the chart it’s 10.5 ms. Typically, this value becomes the baseline for the latency. However, we also need to analyze the frequency of the higher values. These values are known as the tail, and every real system has one. The tail can provide important information about the maximum value and the probability of potentially disruptive events. In our example, we can see that sometimes there are outliers of 50 ms or more.
When you’re choosing an e-trading solution, be sure to check out the latency specification and make sure it matches your business requirements. Monitoring and reporting tools can really help you track and measure latencies, so ask your vendor if they can provide them.
To learn more about our low-latency e-trading solutions, speak to a member of our team.
