Enhancing Implied Volatility modeling: Bridging accuracy and safety with neural networks
Key Takeaways
- Implied Volatility Surface (IVS) models must be arbitrage-free.
- Traditional IVS models are safe but lack accuracy, or vice versa.
- Neural Networks boost accuracy while enforcing no-arbitrage rules.
- Why Implied Volatility matters
Options prices depend heavily on implied volatility (IV), which represents the market forecast of how much an asset price will fluctuate. Traders use IV to gauge risks and opportunities but modeling it accurately can be quite tricky. The challenge? Ensure that the IV surface (which is a plot of IV over strike prices and expiration dates) does not allow arbitrage, that is, does not use price mismatches to obtain guaranteed profits.
Arbitrage opportunities on IV surfaces can be exploited by adopting one or more of the following strategies:
- Calendar spread arbitrage, that is, buy a long-term call and sell a short-term call at the same strike if IV decreases with time.
- Vertical spread arbitrage, that is, exploit mispriced options by buying a lower-strike call and selling a higher-strike call when the prices increase with the strike price.
- Butterfly arbitrage, that is, profit from mispriced options with three staggered strikes.
Traditional models like the Surface Stochastic Volatility Inspired (SSVI) model manage to avoid arbitrage but often fail to capture the real market behavior, leading to consistent pricing errors.
- The limits of traditional models
The SSVI model is a go-to for IV modeling. It’s simple, arbitrage-free, and works across maturities. Its simplicity, however, is a double-edged sword: with only four parameters, it struggles to fit complex market data. Imagine trying to paint a detailed landscape with only four colors: SSVI gets the broad strokes right but misses the finer details.
Building on the limitations of traditional models like SSVI, another noteworthy approach is the WING model. The WING offers remarkable flexibility, enabling it to fit volatility smiles (that is, U-shaped patterns resulting from plotting the IV against the strike) with high accuracy and capture the fine details that simpler models might miss. However, this flexibility comes at a cost. Unlike SSVI, the WING model does not inherently guarantee arbitrage-free fits. Moreover, while it excels at fitting individual slices of the volatility surface, considering only constant maturity segments, it falls short in providing a picture of how implied volatility evolves over different maturities.
- Neural networks: The precision tool
Neural networks excel at finding hidden patterns in data. Based on an approach introduced by Ackerer et al. (2019), which combines SSVI with a NN, we create a hybrid model that:
- Corrects SSVI’s predictions where they deviate from market data.
- Preserves arbitrage-free conditions across the whole surface.
We extend Ackerer et al.’s work by incorporating insights from Physics-Informed Neural Network theory, curriculum training, and transfer learning. Also, we expand the framework beyond European options, enabling it to handle American options.
Training a NN to avoid arbitrage is like teaching someone to drive: start slow, then ramp up difficulty. We use curriculum learning, which consists of the three phases listed below:
- Stage 1: Fitting market data.
- Stage 2: Gradually enforce no-arbitrage rules.
- Stage 3: Fine-tune with strict constraints.
This approach stabilizes training and ensures the model “learns the rules” before mastering complexity.
Also, we employ transfer learning to enhance performance further. By applying past training on volatility surfaces from different days, the NN carries over valuable information to the new training process. This means that the insights and patterns learned from historical data help guide the model as it adapts to new market conditions. As a result, the training becomes more stable and converges faster, typically taking only 30–100 seconds per surface on an ordinary PC.
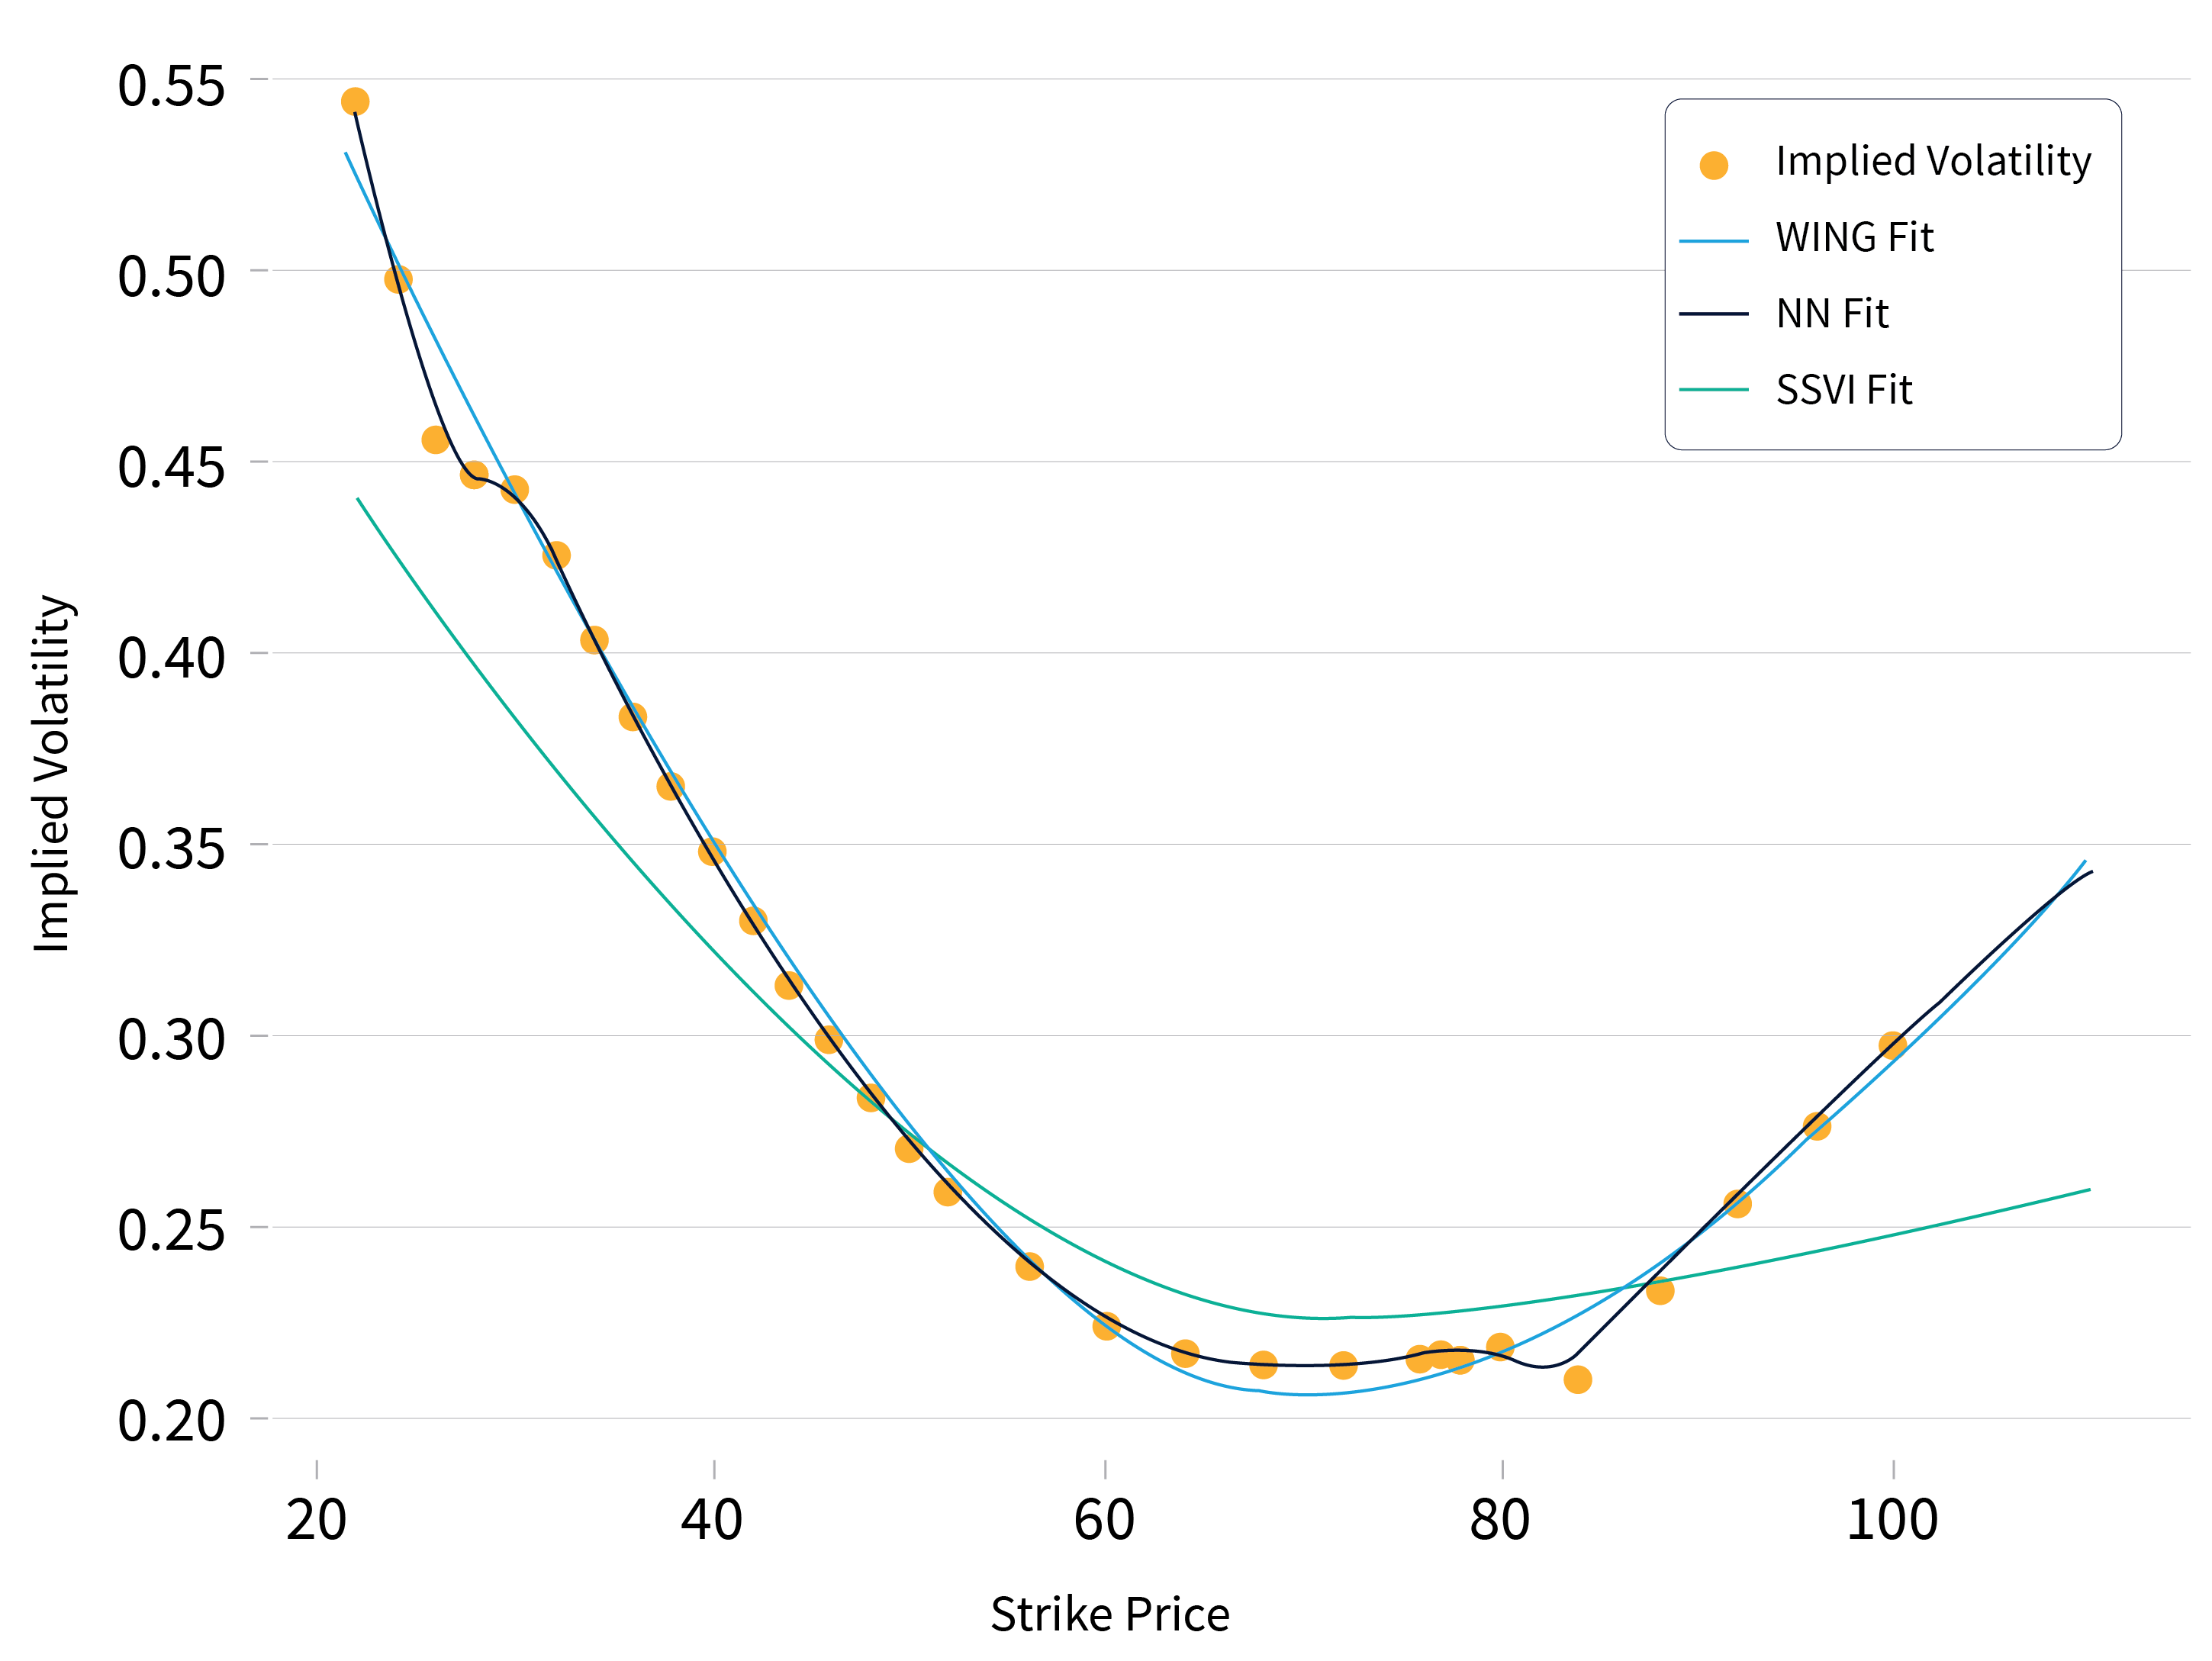
The following picture shows a comparison of implied volatility surface slices fitted using NN, WING, and SSVI models. Among them, SSVI is the least accurate due to its simplicity, while both NN and WING demonstrate greater flexibility in capturing implied volatilities with high precision. Notably, the NN model achieves the highest accuracy.
- Results: Accuracy meets safety
We conducted an empirical study over 234 different volatility surfaces across multiple underlying dates. For each surface, we fitted SSVI, WING, and NN models to compare their performance. We chose the mean absolute percentage error (MAPE) in implied volatility as the performance measure and found that the NN achieved a MAPE over all surfaces of 0.7%, enhancing the 1% and 4.1% of respectively WING and SSVI models. Even considering the worst surfaces (the ones with the highest errors), the MAPE obtained from the NN did not exceed 4%, while WING and SSVI reached 19.5% and 26%, respectively. This demonstrates that the NN remains solid even in the worst-case scenarios.
To test arbitrage opportunities, we ran 3,000 simulations over a grid of strike prices and maturities for each volatility surface fitted by NN and WING models. Each simulation tested whether a risk-free profit can be achieved by following calendar spread, vertical spread, or butterfly strategies on European call options. We say that a test fails when it detects an arbitrage opportunity. The mean percentage of tests failed per surface results as follows:
| Model | Calendar Spread | Vertical Spread | Butterfly |
| NN | 0% | 0% | 0.5% |
| WING | 8.6% | 0.4% | 2.7% |
Notice how the NN, on average, does not allow any arbitrage opportunity for calendar and vertical spread, while it concedes a very small percentage (0.5%) of butterfly arbitrage. Comparing these results with those from the WING model, you can see how promising the NN outcomes can be.
To analyze the financial impact of these arbitrage opportunities, we introduced a new variable called profitability, defined as the risk-free profit obtained from an investment of $1.000. Note that from the perspective of who needs to publish option prices on the market the profit turns into a loss! The median profitabilities for the failed tests are reported in the following table:
| Model | Calendar spread | Vertical spread | Butterfly |
| NN | 0$ | 0$ | 0.05$ |
| WING | 26$ | 417$ | 3$ |
You can note that the NN allows some butterfly arbitrage opportunities, which however are not exploitable in practice: a few cents of profit/loss from a $1.000 investment. On the contrary, WING arbitrage opportunities are significantly more threatening.
These results underline that our NN model not only delivers a significantly enhanced accuracy but also robustly maintains arbitrage-free conditions, offering a compelling balance between precision and safety in implied volatility modeling.
Interested in the technical details of our approach? Stay tuned for our upcoming deep-dive blog!

Don't miss out
Subscribe to our blog to stay up to date on industry trends and technology innovations.