
Business Process Analysis – an ION perspective
A business process is a set of activities performed by actors using systems to achieve a goal within a timeframe.
Despite its simplicity, this general definition can be translated into a varied zoo of real-world business processes resulting from the iterative stratification of decision making and the underlying organizational structures. They are often informed by habits and rarely reviewed by managers, who are active players of the movie themselves. As a result, business processes can be complex, slow to respond to market needs, not standardized, and divergent across dimensions like regions or teams.
Only external forces can initiate a change in these scenarios. A Business Process Analysis (BPA), one of the services provided by ION to external clients and internal divisions, does precisely that.
The first step should achieve a clear picture of the current process as-is, and an ideal target to pursue as a benchmark. With ION BPA, the status is profiled with structured, data-driven analysis of granular activities, inputs, and outputs. Then, this analysis produces findings that are benchmarked to the ideal target with a corresponding set of recommendations. The final recommendations can then be mapped to business reorganizations/integrations — which are timely in M&A events — or to innovative product roadmaps — to make sure new services match client needs and workflows.
ION’s holistic vision of ideal business processes is based on the concept of managing by exception: standardization and automation should be such that the management team is only involved directly to manage exceptions. This requires that processes are centralized, scalable, and can be monitored in real time.
The following vision informs the pillars of ION BPA recommendations:
- Segregation: avoid concurrent interactions of too many systems or actors,
- Reduced complexity: fight convoluted workflows, align operations on standards,
- Digitalization of interactions: streamline exchanges of information/data for reproducibility and historical reuse.
Interestingly, the pillars above can be translated into a wide range of actionable guidelines applied to real-world processes. In each BPA we run, we codify interactions, processes, and systems in use; document all the fluxes of information; abstract contextual concepts and taxonomy; identify situations at risk and root causes of complexity and inefficiencies.
The activities of a BPA are organized in the pyramidal structure showed in Figure 1, with the knowledge at each stage based on the outputs of the previous ones. In parallel with the data collection, we analyze and address new questions/investigation areas discovered throughout. This way, processes are iteratively codified and understood.
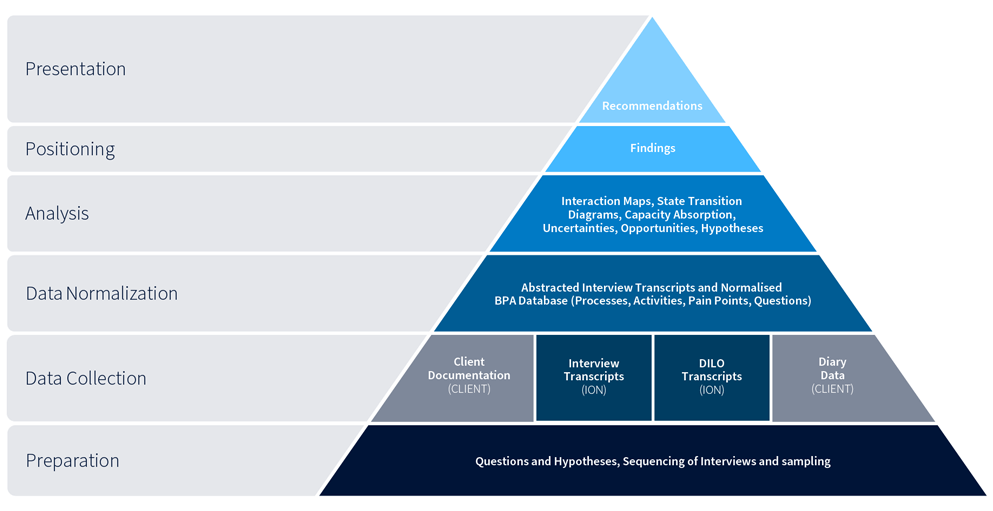
Figure 1 Pyramidal structure of the knowledge-building process of ION BPA
The knowledge we build at each stage is strongly data driven. We run interviews with actors involved in the process end-to-end (E2E), we let them compile Diaries to track activities in a typical workday, we organize Day in the Life of (DILO) workshops, and we analyze documentation. This information is then codified in a structured and normalized database (the BPA database) to uniquely map processes, actors, and systems within the business environment.
The BPA data model relies on well-defined entities (activities, systems, actors, processes, functions, pain points) and allows ION to quantify complexity and risks, presenting findings in the form of numerical tables or charts. Some examples worth mentioning are:
- Interaction Maps, a glance view of the complexity and quality of interactions, are fundamental tools to assess segregation of duties and responsibilities. Figure 2 shows an example of a complex and manual interaction schema, taken from a recent BPA.
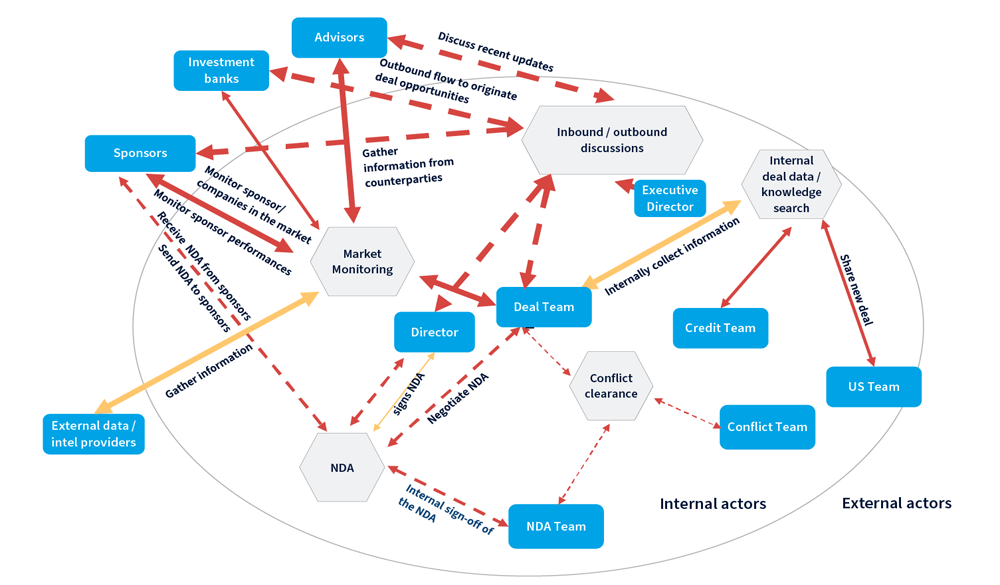
Figure 2 Interaction map. Processes and actors are linked with coded arrows: red arrows indicate manual interactions, orange semi-automatic interactions, green automated interactions - Tables and plots (pie-charts, scatter plots, bar charts) can be used to prioritize risks and inefficiencies quantitatively, drill down across entities, and find correlations to support the recommendations. Figure 3 shows how Pain Points can be clustered by theme and correlated with the number of different systems used.
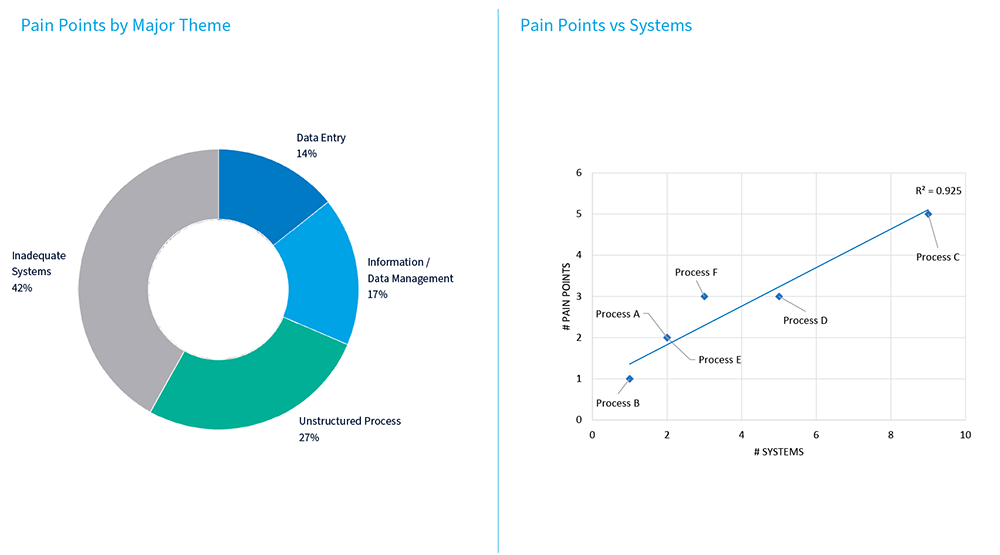
Figure 3 Pie chart of Pain Point motivations and a scatter plot showing correlation between number of systems and Pain Points - Flowcharts show the chronological flow of information and activities within a business process. They are a powerful tool to provide a clear map of the as-is, including the segregation and complexity of interactions. Figure 4 shows an example of a flow chart with many actors involved in the same business process.
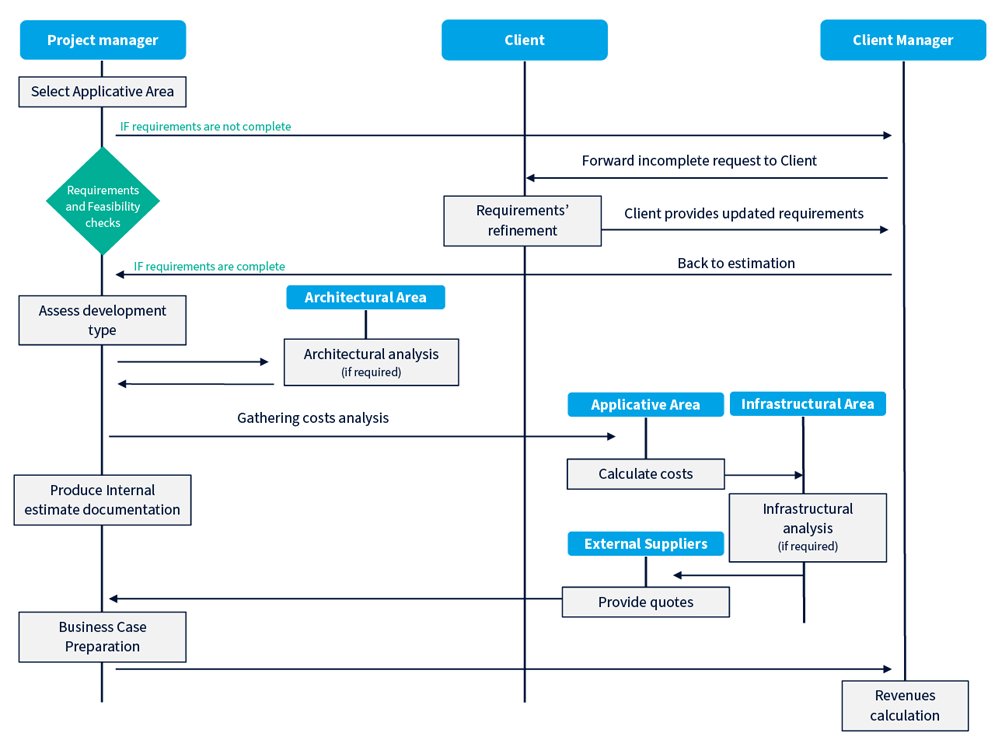
Figure 4 Flowchart showing several actors involved in a single business process
While ION BPAs offer measurable value to clients through documentation of the as-is and actionable recommendations towards the ideal benchmark, they also represent a unique opportunity for an in-depth analysis of client needs to devise together journeys of innovation and transformation.
Recently, we completed an interesting BPA involving a world-leading capital investment firm: we analyzed the investment management pipeline E2E and finally recommended how the identified complexities and inefficiencies should be dealt with. In addition, the unique insights we gathered around our client’s needs were integrated into the innovation roadmap of Xtract, an essential ION Analytics product. Another example involved one of the recent ION Group acquisitions, where our BPA produced actionable items for integrating processes and systems, using synergies, and highlighting idiosyncrasies.
Contact us to learn more about how the ION BPA methodology can be applied to your business area to grasp new business opportunities.