
Why corporates must consider cash flow at risk (CFaR)
In today’s dynamic business environment, corporates must prioritize financial risk management. Evaluating exposure using Cash flow at risk (CFaR) has become a valuable tool. This article will provide information on how CFaR can be assessed and how it can help with strategic decision making.
The COVID-19 pandemic has caused economic downturns, job losses, and declines in GDP in many countries. High geopolitical tensions, cyber security threats, climate change, and uncertain fiscal policies contribute to economic instability, leading to market fluctuations. Corporates should develop risk management strategies to address these risks.
Cash flow at risk (CFaR) is a financial risk management tool that can help corporates assess their possible cash flow exposure to market risks. It calculates the potential range of outcomes for a company’s future cash flows taking into account market fluctuations such as currency volatility, changes in interest rates, and fluctuations in security and commodity prices. As a corporate, you can use CFaR to determine the appropriate level of hedging you need to undertake. It can help with financial planning and forecasting. The results can be helpful in making informed decisions about investments and business operations.
A commonly used model is the 5-step bottom-up approach recommended in the technical documents CorporateMetricsTM and RiskMetricsTM by J.P. Morgan. The model is useful because all necessary data is usually readily available in a Treasury Management System (TMS). The basis for a CFaR calculation process ideally are cash flows from a company’s liquidity plan. This allows for incorporating all operating, investing, and financing activities of the company into the process.
The five steps are metric specification, exposure mapping, scenario generation, valuation, and risk analysis.
Step one: Metric specification
Metric specification includes the definition of a certain confidence level and time horizon that should be considered when calculating the CFaR.
Step two: Exposure mapping
Based on these cash flows risk factors that are involved can be identified, which can include currency risk, interest rate risk, security and commodity price risk. This allows to establish functions, so called “exposure maps”, which determine the relationship between the cash flows and the identified risk factors.
Step three: Scenario generation
The simulation of the FX rates, yield curves and security and commodity prices can take place based on a Monte Carlo Simulation. It is recommended to apply a two-level Monte Carlo Simulation using historic volatilities and forward premiums for the expected values of the simulated prices. In the Level I simulation, only monthly prices are simulated which are then connected by the daily prices that are generated in the level II simulation by building Brownian bridges. This two-level method allows to include time-dependent volatilities with autocorrelations and time-dependent expected values as opposed to constant volatilities and constant expected values. It is recommended to simulate at least 1000 paths to receive 1000 possible market scenarios.
Step four: Valuation
Valuation takes place by inserting the simulated market prices from step three into the exposure maps generated in step two to arrive at one financial result for each market scenario. The distribution of these financial results is used for the risk assessment in the final step.
Step five: Risk analysis
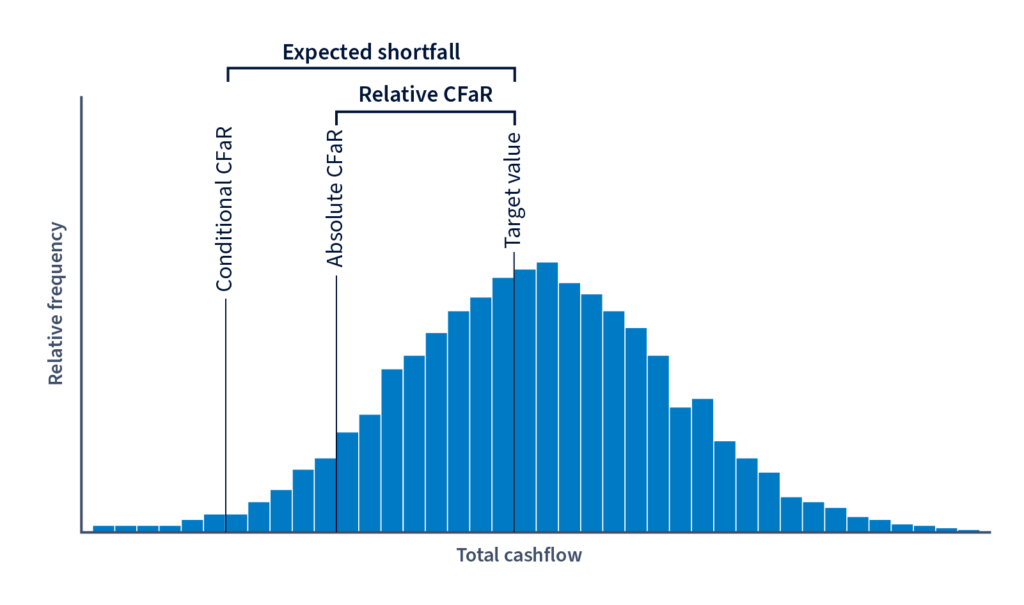
Now the absolute CFaR, which is the minimum financial result for the specified confidence level and time horizon, can be calculated. The relative CFaR is the maximum shortfall of the financial result in relation to a target value for the specified confidence level and time horizon. It’s the difference between the absolute CFaR and the target value.
These CFaR results can be held against CFaR limits. Breaches of these limits indicate additional hedging requirements. Before actual hedges are executed, the risk manager could utilize the functionalities of a TMS and create simulation contracts and re-evaluate their risk exposure by recalculating the key figures including these contracts.
Aside from the absolute and relative CFaR it can also be useful to calculate the conditional CFaR, the expected shortfall, the incremental CFaR as well as worst case scenarios and lower partial moments.
The conditional CFaR is the expected value of the financial result given one of the worst market scenarios that are below the confidence level occurs. The expected shortfall is the difference between the target value and the conditional CFaR. This provides information regarding the negative deviations from expected outcomes.
The incremental CFaR reflects the risk contribution of an individual risk factor to the overall risk. This way the risk manager can immediately see which risk factor contributes the most to the total risk and needs to be focused on in the hedging process.
Lower partial moments allow the risk manager to determine the probability of achieving a certain financial result at a minimum level. This information can support corporates with investment decisions.
CFaR can provide corporates with valuable insights into their cash flow exposure to market risks and help them make more informed decisions about risk management and financial planning. All cash flows that should be considered are usually already available in a TMS and are the basis for risk assessment. If a TMS considers time dependent volatilities, correlations and expected values, a more accurate simulation of the market scenarios is possible. Key figures like relative CFaR, incremental CFaR, and lower partial moments support the risk manager in hedging decisions, financial planning, and investments.

Discover what ION can do for you
Protect your organization from volatility and uncertainty with a unified risk management solution. Request a demo to speak with a risk management expert and explore our suite of treasury management systems with dedicated risk management functionality.