
What’s new in CCP Disclosures – 4Q24?
This content was originally posted by Clarus.
Clearinghouses have published their latest CPMI-IOSCO Quantitative Disclosures:
- Initial margin for major ETD CCPs at $522 billion – a new record – up 2.1 percent QoQ and up 12.5 percent YoY.
- Initial margin for four major IRS CCPs at $327 billion – down 3.4 percent QoQ and down 1.1 percent YoY from the prior quarter record.
- Initial margin for CDS at $61 billion is down 3.3 percent QoQ and up 1.6 percent YoY.
- In 4Q24, several CCP quantitative disclosures show record highs.
- Highlighted are CME, DTCC, ICE, JSCC, LCH, OCC.
- Read our blog for all the details.
Background
Under the CPMI-IOSCO Public Quantitative Disclosures, central counterparties (CCPs) publish over 200 quantitative data fields covering margin, default resources, credit risk, collateral, liquidity risk, back-testing, and more.
CCPView has more than 8 years of these quarterly disclosures for 44 clearinghouses, each with multiple Clearing Services, covering the period from 30 September 2015 to 30 September 2024. This disclosure data provides insights into trends over time at one CCP, and comparisons between CCPs.
Let us look at the latest disclosures.
Initial margin (IM) for IRS
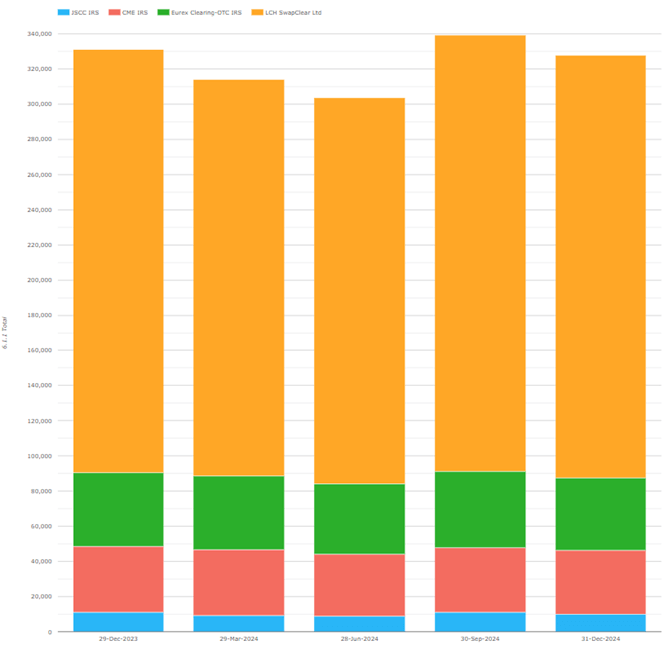
IM at the four major IRS CCPs was $327 billion on 31 December 2024, down $11.5 billion or 3.4 percent QoQ, and down $3.5 billion or 1.1 percent YoY. This level is only $40 million shy of the previous all-time high of $340 billion on 31 March 2023. By CCP, we see:
- LCH SwapClear with $240 billion or £192 billion – in GBP terms, up 3.6 percent QoQ, and up 1.4 percent YoY – exceeding its previous Q423 peak of £188.9 billion.
- Eurex OTC IRS with $41.1 billion or €39.4 billion – in EUR terms, up 1.9 percent QoQ, and up 4.8 percent YoY – but below its Q422 high of €59.4 billion.
- CME IRS with $36.2 billion, down $0.6 billion (1.7 percent) QoQ, and down $1.2 billion (3.3 percent) YoY.
- JSCC IRS with $10.1 billion or ¥1,583 billion – up 1.5 percent QoQ, and down 0.1 percent YoY in JPY terms, but less than its Q323 high of ¥1,941 billion.
IM for CDS
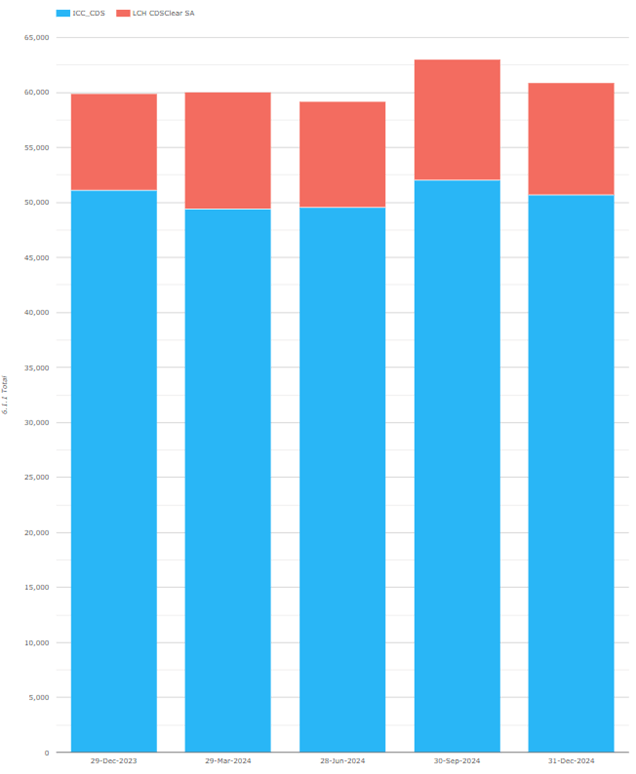
IM at the two major CDS, CCPs totaled $61 billion on 31 December 2024, down $2 billion or 3.3 percent QoQ and up $1 billion or 1.6 percent YoY. This has been consistently close to $60 billion for over a year having peaked above $75 billion in 2022. By CCP, we see:
- ICE Credit Clear with $50.7 billion, down $1.4 billion or 2.6 percent QoQ and down $0.4 billion or 0.8 percent YoY.
- LCH CDSClear with $10.2 billion or €9.8 billion, up €0.05 billion or 0.5 percent QoQ and up €1.8 billion or 23 percent YoY.
IM for ETD
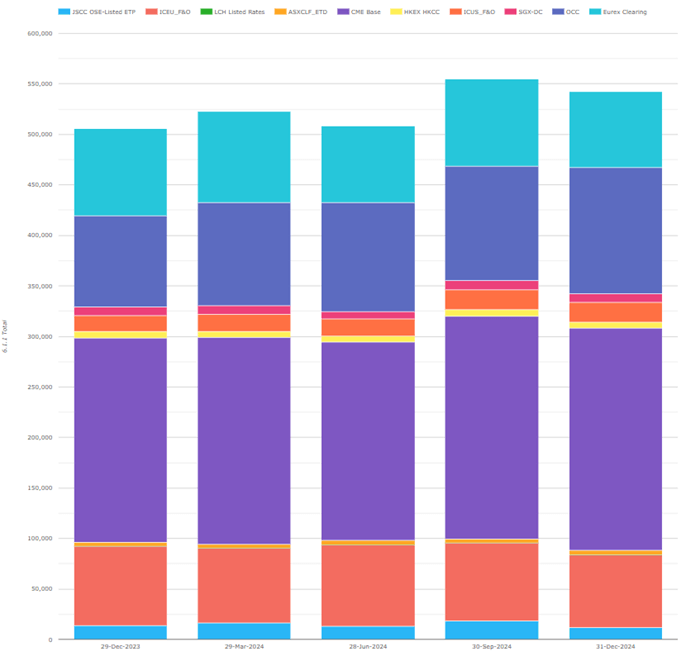
IM at our selected ETD CCPs was $522 billion on 31 December 2024, up $11 billion or 2.1 percent QoQ, and up $58 billion or 12.5 percent YoY – beating the record set in the prior quarter. (The chart shows higher totals as Eurex includes OTC IRS IM, which I exclude). By CCP, we see:
- CME Base with $220.1 billion, down 0.3 percent ($0.6 billion) QoQ and up 8.6 percent ($17.5 billion) YoY.
- OCC with $124 billion, up 11 percent QoQ ($12 billion) and up 38 percent ($34 billion) YoY.
- ICE Europe F&O with $71.9 billion, down 6.8 percent ($5.2 billion) QoQ and down 8.4 percent (6.6 billion) YoY.
- Eurex with $55 billion, up 29 percent ($12 billion) QoQ and up 24 percent ($11 billion) YoY.
- ICE US F&O $19.2 billion, down 3 percent ($0.6 billion) QoQ and up 21 percent ($3.3 billion) YoY.
- JSCC OSE Listed ETP with $12 billion, down 34 percent ($6 billion) QoQ and down 14 percent ($2 billion) YoY.
- SGX-DC $8.6 billion, down 9 percent ($0.8 billion) QoQ and up 8 percent ($0.6 billion) YoY.
- HKEX HKCC with $6.1 billion, down 7 percent ($0.6 billion) QoQ and down 3 percent ($0.2 billion) YoY.
- ASX CLF ETD $4.3 billion, up 2 percent ($0.1 billion) QoQ and up 17 percent ($0.6 billion) YoY.
Other disclosures of interest
Next let us do a quick scan of 31 December 2024 disclosures for major clearinghouses, highlighting those with significant changes.
- CME – the CME Base KCCP for its qualifying CCPs dropped to 27 from 177 the prior quarter, while the CME IRS KCCP increased to 28 from 27 the prior quarter.
- DTCC GSD (the FICC’s UST clearinghouse as discussed in my ION Markets Blogs) – 6.1.1 Total IM required was $65.5 billion (up 16 percent QoQ and 36 percent YoY) – another new record, reflecting continued progress towards the SEC UST clearing mandate and translating naturally to increases in other margin-related metrics.
- DTCC NSCC (an equities and corporate bond clearing service) – both 7.3.3 and 7.3.7 Amount Exceeded were $7 billion compared with $4 billion in the prior quarter.
- ICEU (European IR F&O CCP) 7.1.8 Liquid GBP resources fell back to £2.8 billion after peaking at £4.0 billion in the prior quarter.
- JSCC IRS had 23.1.1 OTC JPY average daily volumes fell back to 749 trades after the prior quarter high of 845 trades.
- LCH SwapClear 4.2.1 KCCP was up to 343 from 311 the prior quarter.
- LCH ForexClear 6.8.1 Maximum aggregate IM call on any day in the quarter rose to 2.8 billion from the prior peak of 1.7 billion in Q1 2024. 14.1.1 Total client positions as a share of notional values cleared also rose by 1.7x to 9.80% from 5.63% the prior quarter. By comparison, 6.1.1 client and total IM grew by less than 10 percent.
- LCH Listed Rates showed their first disclosures in Q4. Notably, there are:
- 6 clearing participants (all non-UK) of whom 3 are banks and 3 are non-banks;
- $3.6 billion of 23.2.1 ETD Listed Rates USD gross notional outstanding; and
- $3 million of 6.1.1 Total IM, all of which is client IM.
- LCH SA Bonds and Repos 23.2.1 EUR gross notional outstanding of novated but not settled cash bond trades dropped to €1.9 billion from €84.9 billion the prior quarter – perhaps indicating a major clear-up of breaks has occurred.
- LCH SA Cash and Derivatives stopped reporting in quarter 4 after migrating the clearing of Borsa Italiana to Euronext in September 2024 (LSEG sold the Italian exchange to Euronext three years ago).
- LCH CDSClear SA 1.18.1.1 Number of general clearing members increased by 1 to 20; 1.18.1.2.3 Number of bank participants increased by 2 to 20; and 1.18.1.3.2 Number of foreign participants increased by 1 to 24.
- OCC 6.1.1 total IM required was $125 billion – up 11 percent QoQ from $113 billion – reflecting increases in both client and house IM. This beats OCC’s prior record total IM of $121 billion in Q4 2021.
- We could go on…
- There are a lot more Clearing Services and Disclosures for non-major clearinghouses, but I will stop there and leave it to those of you with CCPView access to analyze further changes.
- As well as a Web UI, we also offer an API to access this data programmatically.
IOSCO Quantitative Disclosures
CCPView has disclosures from 44 clearinghouses, each with many Clearing Services covering Equities, Bonds, Futures, Options, and OTC Derivatives – with over 200 quantitative data fields each quarter and quarterly figures from September 2015 to September 2024.
If you are interested in this data, please get in touch.
Stay informed with our FREE newsletter, subscribe here.

Don't miss out
Subscribe to our blog to stay up to date on industry trends and technology innovations.