SOFR options – How healthy is the market?
This content was originally published by Chris Barnes on clarusft.com.
Key Takeaways
- Options trading accounts for 22% of all notional equivalent volume in SOFR futures and nearly 60% of Open Interest.
- In the old LIBOR world, options trading accounted for slightly more of the trading activity (4% to 8% more depending on the metric).
- The picture is very different for OTC options, which struggle to reach 10% of the notional equivalent activity in swaps.
- Overall, SOFR options have achieved a remarkably mature market state within two years of LIBOR transition.
With LIBOR now a distant memory, is options activity in USD rates markets back to pre-cessation levels? Let’s tour the data….
Futures – exchange traded options on SOFR contracts
Options on Exchange Traded Derivatives are the “standardized” version of non-linear liquidity, with standardized expiries (quarterly, monthly and even weekly for certain underlyings) and strikes in standardized increments (6.25bp-25bp depending on the underlying futures contract and time to expiry).
CCPView collects data daily on the traded volumes, and has a rich history going back to at least 2017. That means we can look at how volumes in USD options contracts have behaved before, during and after USD LIBOR cessation:
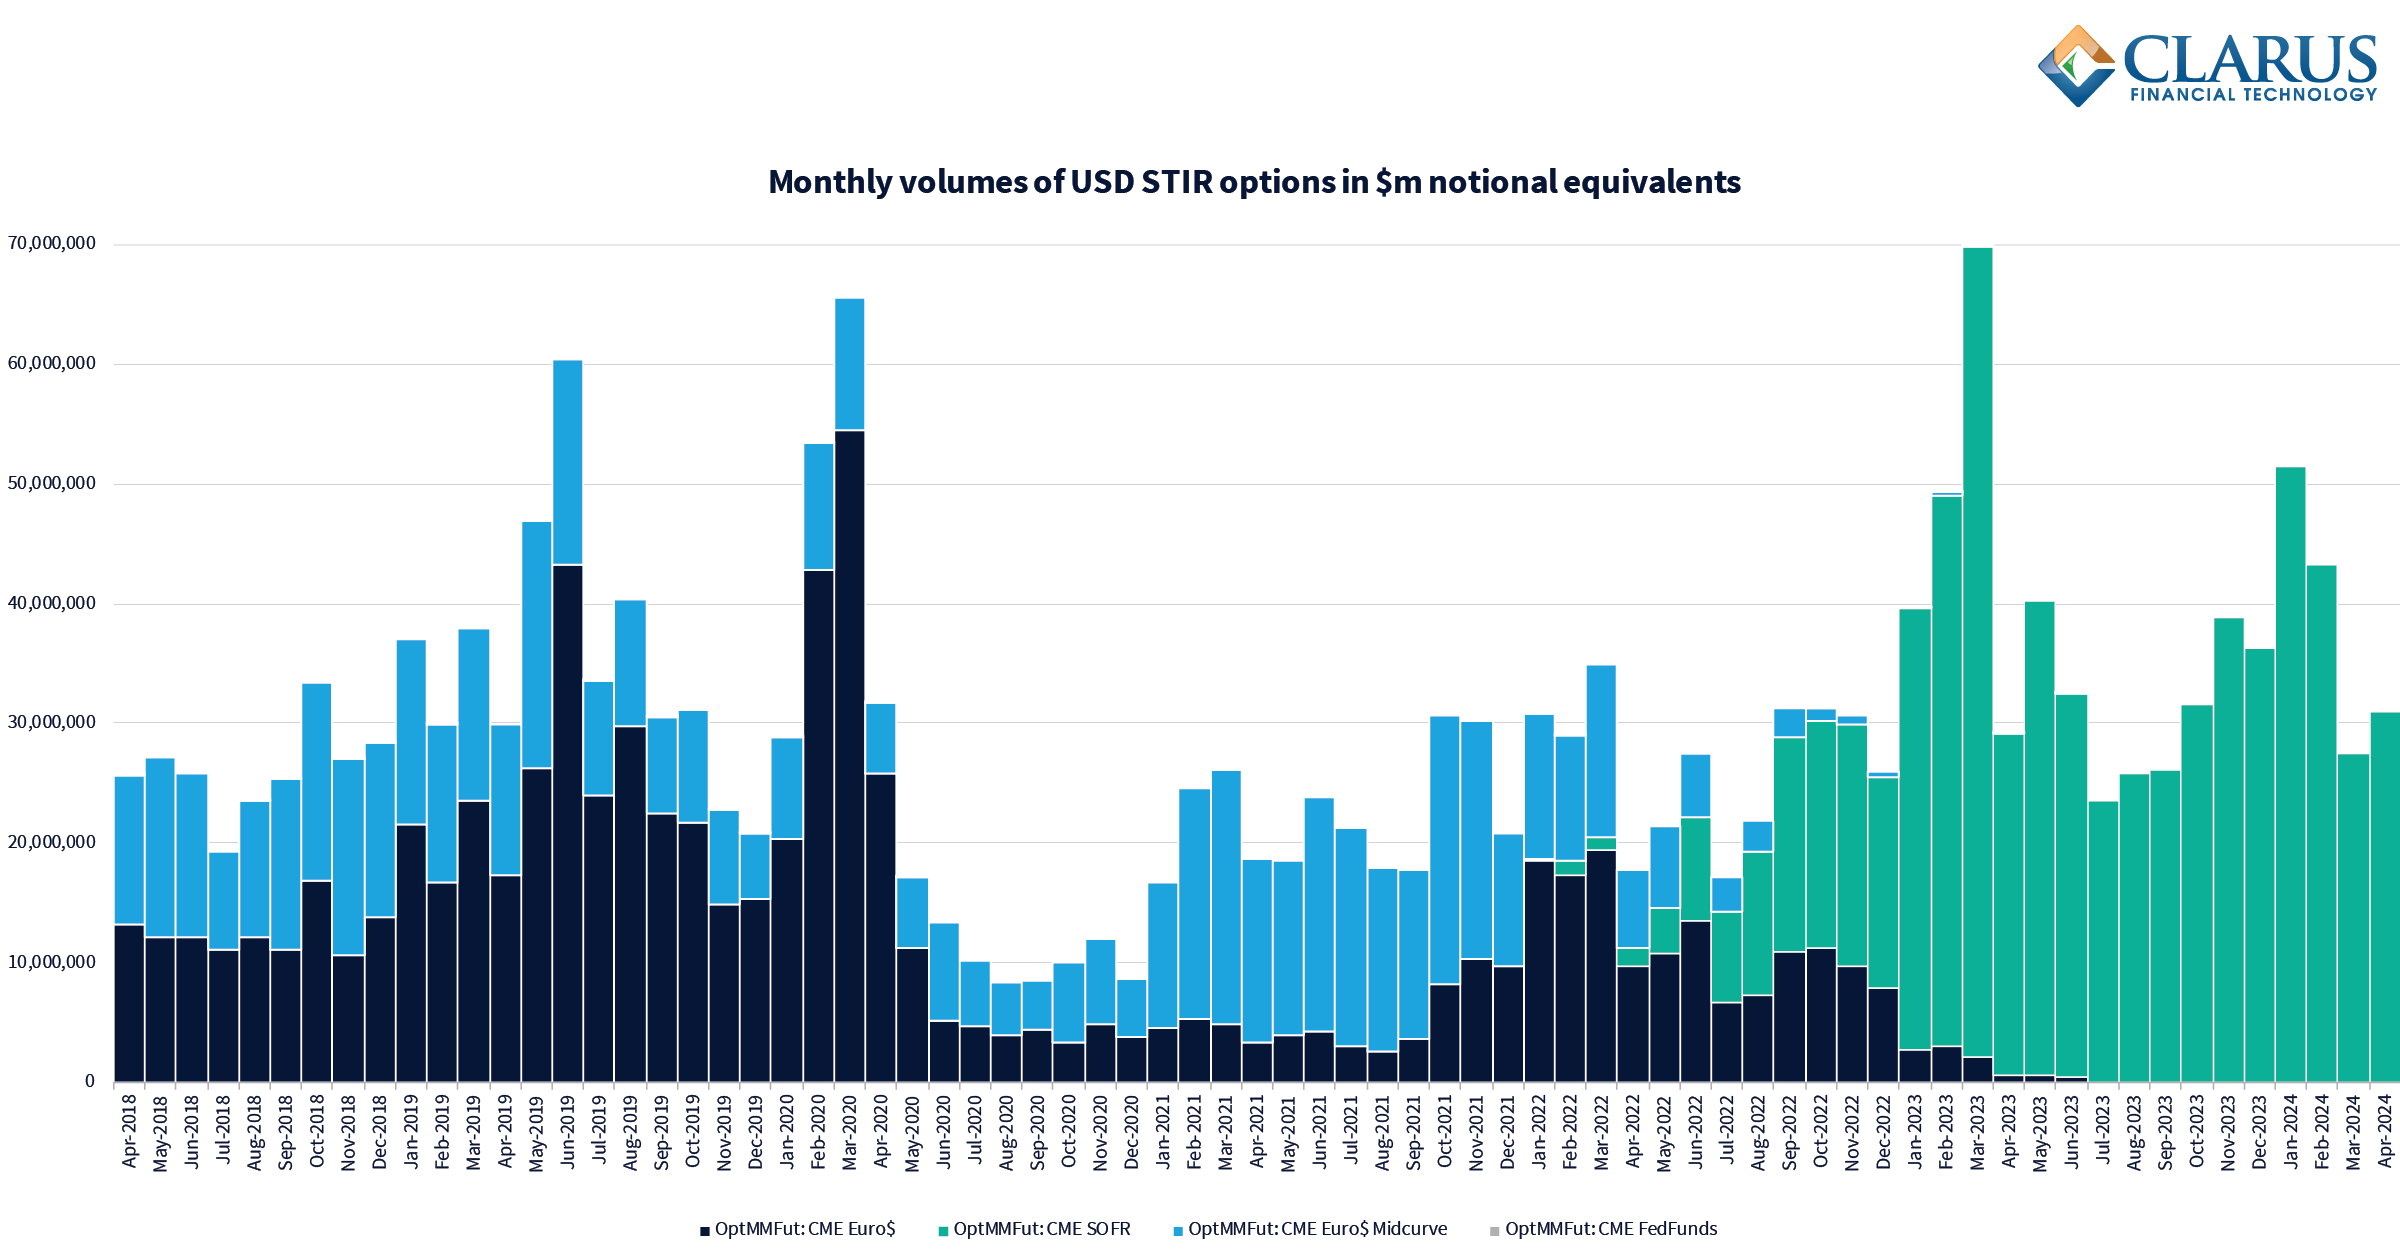
Monthly volumes of USD STIR options in $m notional equivalents. Source: CCPView
- Monthly volumes in notional equivalents ($m) of Eurodollar, Fed Funds and SOFR exchange traded options.
- Monthly volumes are highly volatile (as are the volumes on the underlyings), with 2020 jumping out as unusually subdued (as Rates went back to zero).
- However, volumes since the final cessation of USD LIBOR have picked-up and are back to, if not even higher, than pre-cessation.
- Two chart-related points. We have not broken out the volumes of SOFR Options versus Mid-curves, but both are counted. And options on Fed Funds are tiny in comparison so we won’t mention them again.
Volume ratio
It doesn’t really make sense to look at these volumes in isolation, so I combine the data with the traded volumes of the underlying to examine the relative amount of Options activity each quarter:

Source: CCPView
Showing:
- Average Daily Volume ($m) per quarter of all traded STIRs in USD (Eurodollars, Fed Funds and SOFR) versus activity in options contracts versus the same.
- Activity in the underlying contracts is something like 4x higher than in options contracts, meaning that the ratio of activity ranges between 20-30%.
- There is some intrinsic link here, but the delta of most options contracts will naturally be well below 100%.
- Were options on Eurodollar contracts, back in 2018–2020 a little more active than in SOFR?
- The average was 26% in the first two years of our time-series, and has been 22% in the last two years. Is a 4% relative reduction in activity significant?
- My gut feeling is that with underlying interest rates higher now (and uncertainty over upcoming cuts), I would expect to see more activity now than in 2018.
- On the face of it, this suggests that options trading in SOFR has a little way to go to equal activity in Eurodollars.
- Maybe this shouldn’t be such a surprise given Eurodollars had a credit-spread element, and hence options trading offered up certain protective strategies against credit-induced spikes in LIBOR fixings.
- Under the current environment (and similar to the SVB crisis last year), it is not clear how SOFR fixings would react to pure credit stresses against an inflationary backdrop – leaving only XCCY basis that is predictable (in a crisis) these days.
Open Interest ratio
What about the same ratio but expressed in terms of Open Interest? Those assuming that the ratio will surely be because option contracts at different strikes and/or expiries do not offset against each other would be right:

Source: CCPView
Showing:
- Open Interest is higher in options than in the underlying – as expected.
- In “LIBOR days”, this ratio sat at 67%.
- It is now down to 59%.
- That is a bigger reduction in the ratio than we saw for volumes, but Eurodollars had 30 years of trading to become such a mature options market place. I would argue that SOFR options have done well to catch up so quickly.
OTC – options vs swaps
Having blogged recently on Swaptions, it seems only right to run this same volume ratio in OTC markets as well. From SDRView:

Source: CCPView
Showing:
- This chart is somewhat surprising. It shows the “package adjusted” trade count – that is, now counting Straddles as a single trade again. See blog here for details on the data changes.
- However, the amount of activity in Swaptions is so much lower than in Swaps that any changes in the data barely impact the ratio.
- Indeed, the ratio of swaps to options activity is something like half that seen in exchange traded markets.
- This has always been the case, even before LIBOR cessation – it used to be 9% and it is still 9%.
- This particular ratio of activity is remarkably stable – 7% and 12% are the highs/lows despite the potential changes in the data and the change in the underlying index!
In summary
- SOFR Options make-up 22% of volume and 60% of Open Interest relative to SOFR futures.
- The Options component of futures used to be slightly higher in the old LIBOR world, despite Interest Rates being lower.
- Swaptions, on the other hand, still make up less than 10% of all traded volumes in OTC Rates – with LIBOR cessation having had seemingly no impact on their relative use compared to linear products.
- The ratio of activity between options and linear products is one to monitor.

Don't miss out
Subscribe to our blog to stay up to date on industry trends and technology innovations.