
FX derivatives volumes at the end of Q4 2025
This content was originally published by Clarus.
This blog covers the volumes of FX derivatives (FXD) in December 2025, following on from our prior blog on September 2025 FXD volumes.
Key Takeaways
- December 2025 saw overall FXD notional volumes declining quarter-on-quarter (QoQ), after volume increases earlier in 2025.
- Cleared NDFs on non-deliverable currencies grew QoQ by 2.1 percent and grew year-on-year (YoY) by 39 percent.
- Cleared NDFs on deliverable currencies declined QoQ by 45 percent and grew YoY by 7.6 percent.
- Cleared FX options declined QoQ by 29 percent, though they grew YoY by 54
- SDR-reported NDFs on the top 11 non-deliverable currencies declined QoQ by 7.6 percent, though they grew YoY by 22 percent.
- SDR-reported NDFs on the top 16 deliverable currencies declined QoQ by 56 percent, though they grew YoY by 29 percent.
- SDR-reported FX options on the top 15 currencies declined QoQ by 26 percent and declined YoY by 11.2 percent.
- As we explain, the steep Q4 volume declines in NDFs on deliverable currencies may originate from the volume declines in uncleared FX options from Q2 onwards via FX optimization vendor runs.
Read on for more analysis and further explanation.
All the charts and details in this blog were sourced from CCPView and SDRView.
Cleared FXD volumes
First, we look at cleared FXD by product type: non-deliverable forwards (NDFs), options, forwards, and spot.
Chart 1: Cleared FXD by product (notional $ millions). Source: CCPView
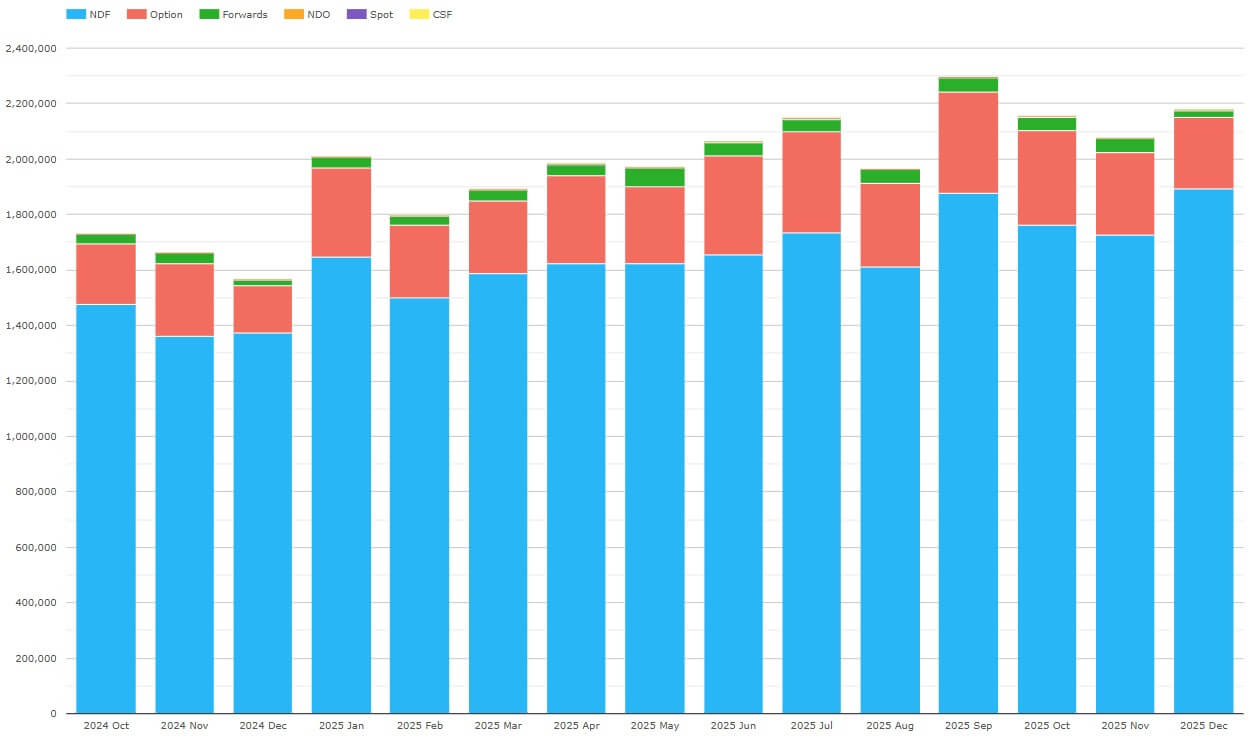
Chart 1 shows that December 2025 cleared FXD notional volumes were $2.18 trillion – down 5.1 percent QoQ from the record of $2.30 trillion set in September 2025. Nonetheless, December 2025 exceeded all past months other than September 2025 and was up 39 percent YoY from $1.57 trillion in December 2024.
- NDFs were by far the largest with a new high of $1.89 trillion – up 7 percent QoQ from the prior high in September 2025, and up 38 percent YoY.
- FX options were next largest with $259 billion – down 29 percent QoQ, but up 54 percent
- Forwards were $26.5 billion – down 48 percent QoQ, but up 17 percent
- Non-deliverable options (NDOs) were $2.30 billion – down 2.1 percent QoQ, but up 271 percent YoY.
- Spot was $666 million – down 39 percent QoQ, but up 69 percent
Let’s dig into NDFs, starting with NDFs on non-deliverable currencies.
Chart 2: Cleared NDFs on non-deliverable currencies (notional $ millions). Source: CCPView
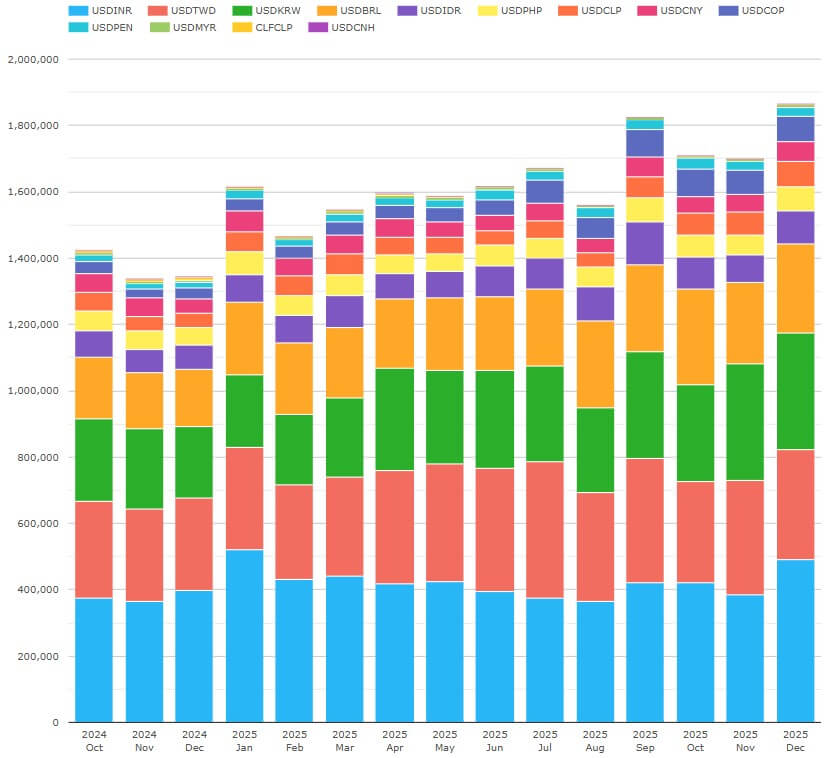
Chart 2 shows that cleared NDFs on non-deliverable currencies had increasing volumes throughout 2025. Of the $1.89 trillion December cleared NDFs in chart 1, non-deliverable currencies were $1.86 trillion – up 2.1 percent QoQ, and up 39 percent YoY. We highlight the top nine currencies.
- INR was the largest at $490 billion – up 26 percent QoQ, and up 23 percent
- KRW was next at $351 billion – up 6 percent QoQ, and up 62 percent YoY.
- TWD was $332 billion – down 11.3 percent QoQ, but up 18 percent YoY.
- BRL was $271 billion – up 6 percent QoQ, and up 58 percent YoY.
- IDR was $98.4 billion – up 25 percent QoQ, and up 35 percent
- COP was $76.8 billion – down 6.7 percent QoQ, but up 130 percent
- CLP was $75.7 billion – up 25 percent QoQ, and up 76 percent
- PHP was $72.7 billion – down 0.8 percent QoQ, but up 35 percent
- CNY was $59.2 billion – down 1.5 percent QoQ, but up 44 percent
Next, we show NDFs on deliverable currencies.
Chart 3: Cleared NDFs on deliverable currencies (notional $ millions). Source: CCPView
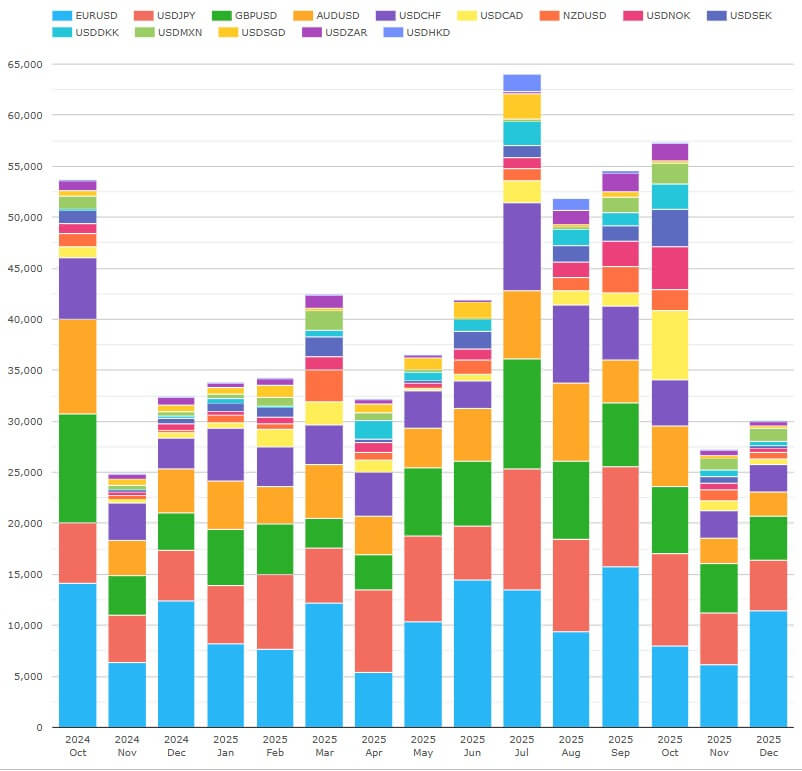
Chart 3 shows that November and December volumes of cleared NDFs on deliverable currencies were sharply lower than those from July to August. Of the $1.89 trillion December cleared NDFs in chart 1, deliverable currencies were $29.9 billion – down 7.6 percent YoY, and down 45 percent QoQ.
- EUR was the largest at $11.5 billion – down 27 percent QoQ, and down 2 percent YoY.
- JPY was next at $4.9 billion – down 50 percent QoQ, and down 1.7 percent YoY.
- GBP was $4.3 billion – down 32 percent QoQ, but up 19 percent YoY.
- CHF was $2.8 billion – down 48 percent QoQ, and down 11.7 percent YoY.
- AUD was $2.4 billion – down 44 percent QoQ, and down 45 percent YoY.
- Seven other deliverable currencies (MXN, NZD, CAD, DKK, NOK, ZAR, SEK, SGD) were a combined $4.1 billion – down 68 percent QoQ, but up 3.5 percent YoY.
- HKD had no volume in Q4 2025 after having volume in all three months of Q3 2025.
Now, we look at NDFs market share by CCP.
Chart 4: CCP shares of volume of cleared NDFs (notional percentage). Source: CCPView
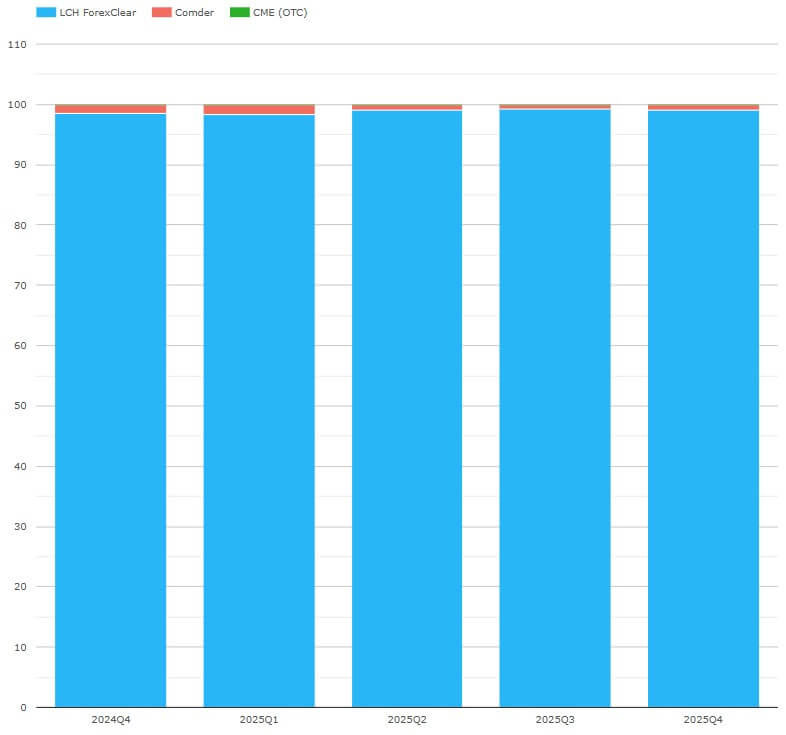
Chart 4 shows ForexClear continues to dominate market share:
- LCH ForexClear had 99.1 percent in Q4 2025 – up YoY from 98.4 percent, but down QoQ from 3 percent.
- ComDer had 84 percent – down YoY from 1.54 percent, but up QoQ from 0.67 percent.
- CME OTC was 0.032 percent – down YoY from 0.039 percent, and down QoQ from 0.046 percent.
Moving onto FX options, cleared volumes break down as follows.
Chart 5: Cleared FX options (notional $ millions). Source: CCPView
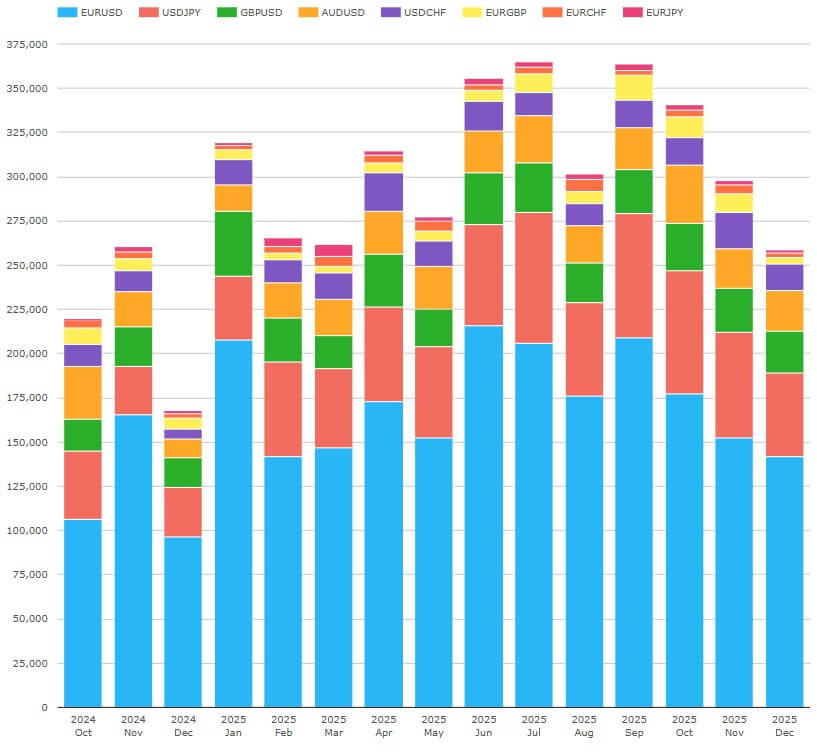
Chart 5 shows that cleared FX options declined in each month of Q4 after their highest ever two months in July and September (which were each just below $365 billion). We can break out the $259 billion December cleared FX options in chart 1.
- EUR was by far the largest at $142 billion – down 32 percent QoQ, but up 47 percent YoY.
- JPY was next at $47.8 billion – down 32 percent QoQ, but up 72 percent YoY.
- AUD was next at $23.3 billion – down 1.0 percent QoQ, but up 114 percent YoY.
- GBP was next at $23.1 billion – down 15 percent QoQ, but up 26 percent YoY.
- CHF was next at $14.6 billion – down 7.5 percent QoQ, but up 153 percent YoY.
- Crosses against EUR (in GBP, CHF, and JPY) made up the remainder of cleared FX options totaling 8.2 billion – down 734 percent QoQ, and down 37 percent YoY.
All FX options were cleared at LCH ForexClear.
SDR–reported FXD volumes
As a note, SDR-reported volumes include both uncleared and cleared trades. While cleared trades are larger in volume than uncleared for rates derivatives, uncleared trades predominate in FXD.
Now, we look at SDR-reported FXD, starting with NDFs on non=deliverable currencies.
Chart 6: SDR-reported NDFs on the top 11 non-deliverable currencies (notional $ billions). Source: CCPView
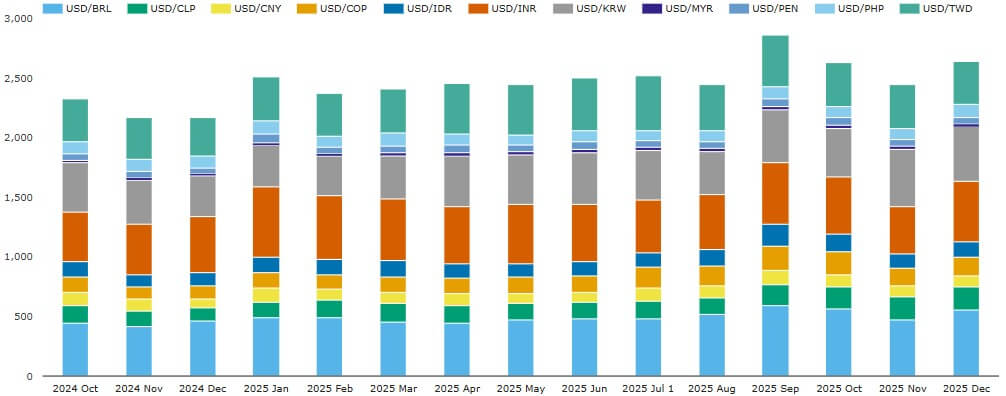
Chart 6 shows that volumes of NDFs on the top 11 non-deliverable currencies increased in most months over the period shown. The top 11 non-deliverable currencies had a combined total SDR-reported NDFs volume of $2.65 trillion in December 2025 – down 7.6 percent QoQ from the record $2.89 trillion in September 2025, but up 22 percent YoY. The top 11 currencies were 98.8 percent of NDFs on non-deliverable currencies.
- BRL was the largest at $551 billion – down 6.1 percent QoQ, but up 3 percent YoY.
- INR was next at $510 billion – down 1.1 percent QoQ, but up 8.8 percent YoY.
- KRW was $457 billion – up 2.6 percent QoQ, and up 31 percent YoY.
- TWD was next at $367 billion – down 1.4.5 percent QoQ, but up 12.4 percent YoY.
- CLP was $197 billion – up 11.5 percent QoQ, and up 82 percent YoY.
- COP was $165 billion – down 17.6 percent QoQ, but up 56 percent YoY.
- IDR was $124 billion – down 32 percent QoQ, but up 0 percent YoY.
- PHP was $106 billion – down 2.5 percent QoQ, but up 9.0 percent YoY.
- CNY was $86.5 billion – down 30 percent QoQ, but up 14.1 percent YoY.
We move on to NDFs on deliverable currencies.
Chart 7: SDR-reported NDFs on the top 16 deliverable currencies (notional $ millions). Source: CCPView
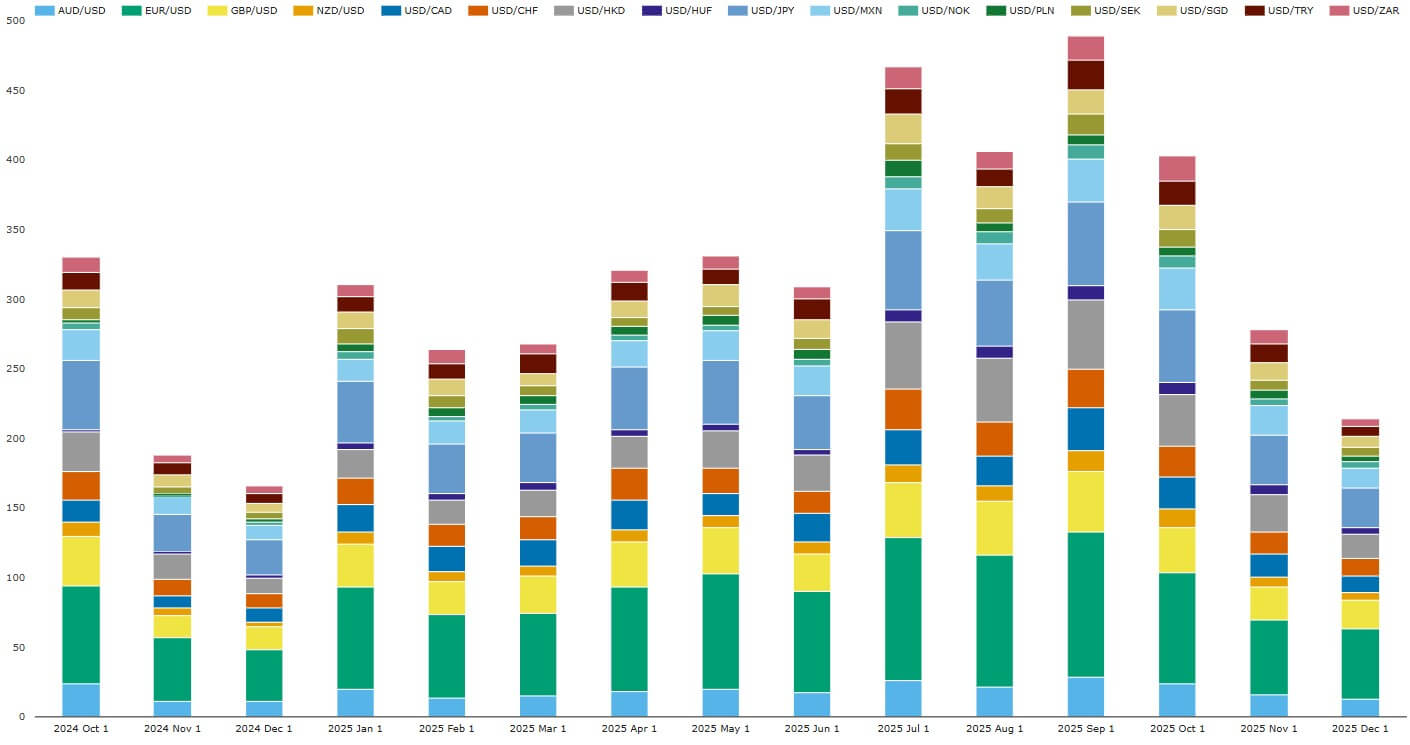
Chart 7 shows that volumes of NDFs on deliverable currencies declined steeply in each month of Q4 2025. The top 16 deliverable currencies had a combined total SDR=reported NDFs volume of $214 billion in December 2025 – up 29 percent YoY, but down 56 percent QoQ. (The top 16 deliverable currencies were 98.8 percent of NDFs on all deliverable currencies.)
- EUR was the largest at $50.4 billion – down 56 percent QoQ, but up 34 percent YoY.
- JPY was next at $28.8 billion – down 52 percent QoQ, but up 6 percent YoY.
- GBP was $20.3 billion – down 54 percent QoQ, but up 25 percent YoY.
- HKD was $17.5 billion – down 65 percent QoQ, but up 55 percent YoY.
- MXN was $13.6 billion – down 56 percent QoQ, but up 32 percent YoY.
- AUD was $13.0 billion – down 54 percent QoQ, but up 20 percent YoY.
- CHF was $12.5 billion – down 55 percent QoQ, but up 23 percent YoY.
- CAD was $11.7 billion – down 62 percent QoQ, but up 6 percent YoY.
Next, we look at SDR-reported vanilla FX options for the top 15 currencies.
Chart 8: SDR-reported FX options on the top 15 currencies (notional $ millions)
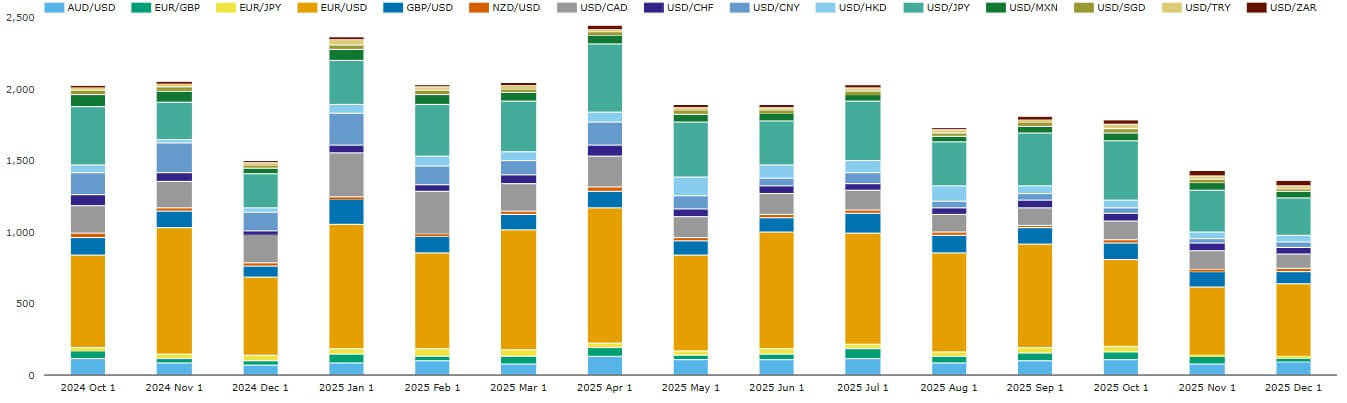
Chart 8 shows a general decline in SDR-reported FX option volumes from early Q1 2025. The top 15 currencies had a combined total SDR-reported FX options volume of $1.36 trillion in December 2025 – down 25 percent QoQ, and down 9.1 percent YoY. (The top 15 currencies were 90 percent of FX options.)
- EUR was by far the largest at $506 billion – down 30 percent QoQ, and down 7.0 percent YoY.
- JPY was next at $265 billion – down 28 percent QoQ, but up 12.1 percent YoY.
- CAD was next at $104 billion – down 14.9 percent QoQ, and down 48 percent YoY.
- AUD was next at $94.2 billion – down 5.8 percent QoQ, but up 35 percent YoY, overtaking GBP.
- GBP was next at $86.9 billion – down 24 percent QoQ, but up 10.4 percent YoY.
- HKD was next at $22.7 billion – down 4 percent QoQ, but up 87 percent YoY.
- CHF was next at $42.7 billion – down 6 percent QoQ, but up 45 percent YoY.
- CNY was next at $37.4 billion – down 20 percent QoQ, and down 72 percent YoY.
- NZD was next at $31.3 billion – down 4 percent QoQ, but up 0.14 percent YoY.
- SGD was next at $13.2 billion – down 51 percent QoQ, and down 29 percent YoY.
- Crosses against EUR (in GBP, CHF, and JPY) made up the remaining volume of $50.6 billion, down 40 percent YoY, and down 50 percent QoQ.
Comparing product category trends
It’s interesting to compare the growth rates over 2025 of the three major product categories. To construct the summary below, we pulled additional queries including all currencies in each product category (not just the subsets used for NDFs above).
Table 1: quarterly SDR-reported and QoQ growth of three FXD product categories (notional $ billions)
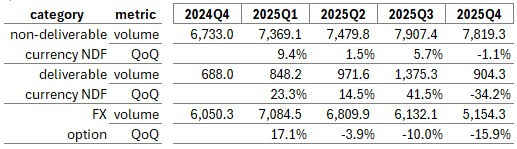
Table 1 includes all SDR– reported volumes of all currencies in each category, and shows that:
- NDFs on non-deliverable currencies grew less than 10 percent in each of Q1, Q2, and Q3, and began to decline in Q4.
- NDFs on deliverable currencies grew rapidly in each of Q1, Q2, and Q3, and then declined rapidly in Q4.
- FX options grew rapidly in Q1, and then declined increasingly in Q2, Q3, and Q4.
As we showed in blogs here and here, deliverable currency NDFs result predominantly mainly from FX IM optimization vendor runs. The optimization runs tackle SIMM IM requirements arising from FX counterparty risk, which is principally a result of uncleared FX options trading. This may explain the decline in volumes of deliverable currency NDFs starting in Q4, following the increasing declines in FX options in Q2, Q3, and Q4.
That’s it
We used eight charts and one table to cover FXD.
You can find a lot more data in CCPView, including:
- Analysis by date, week, month, quarter, or year.
- Volume metrics beyond new trade notional to trade count, average daily volume (ADV), open interest, and notional unwound/matured.
- More granular CRD volumes at index series or single-name level.
- FXD volumes for exchange-traded derivatives.
Contact us if you’re interested in a subscription.
Stay informed with our FREE newsletter, subscribe here.

Don't miss out
Subscribe to our blog to stay up to date on industry trends and technology innovations.