
How large are Cleared Swap markets?
In today’s article I am going to look into the size of Cleared Swap markets.
Swaps are an Over-the-counter (OTC) Derivative product, which are traded either on regulated trading venues such as Swap Execution Facilities (SEF) in the US or Multi-lateral trading facilities (MTF) in Europe or bi-laterally between market participants. After execution these trades are presented to a Central Counterparty (CCP) which novates the trade to become the counterparty to both parties to the original trade, in much the same manner that Futures are cleared.
As a small number of global CCPs dominate Swaps clearing, we can get the best insight into how large Swap markets are by looking at the volumes and outstanding notional (aka open interest) at these CCPs.
Outstanding Notional at Swaps CCPs
Using CCPView, we can view outstanding notional by Asset Class and CCP as of 30 June 2023.
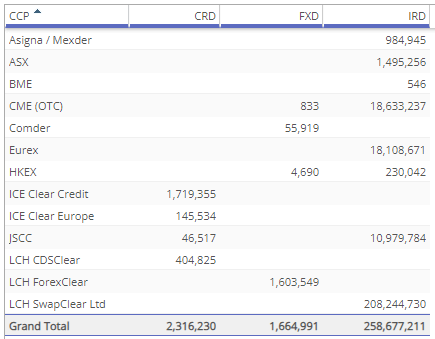 (in USD millions)
Showing that:
- IRD, Interest Rate Derivatives are by far the largest class with $258.7 trillion of notional outstanding as of 30 June 2023.
- And LCH SwapClear Ltd with $208 trillion (single-sided gross notional) represents most of the IRD outstanding notional.
- CRD, Credit Derivatives has $2.3 trillion outstanding, while FXD (FX Derivatives) has $1.67 trillion.
The dominance of IRD is down to a number of factors, including the fact that interest rate risk is a major risk that is managed using derivatives by financial firms, trade notionals are much larger than in CRD and FXD and there are clearing obligations in place for many IR Swaps unlike FXD where most volume is bilateral and not cleared.
Now figures in the trillions sound very large, but are not easy to imagine and put in context. One way to get more insight is to compare these with similar markets and look at relative sizes.
Comparing with Futures and Options OI
In CCPView, lets select both ETD and OTC, focus on Interest Rate and the six major currencies; AUD, CAD, EUR, GBP, JPY, USD and the Open Interest (OI).
For ETD Futures and Options, CCPView has OI in both number of contracts and dollar notional (calculated from contract size), so we will use the latter as the appropriate comparison with the OTC outstanding notional.
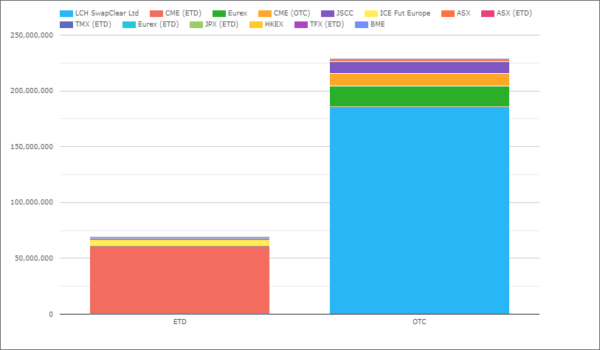 (in USD millions)
- ETD Open Interest of $69 trillion as of 30 June 2023, which is dominated by CME with $60.6 trillion and includes both Futures and Options on money market and bond futures.
- OTC Open Interest of $228 trillion, which we note for these six major currencies represents most of the $258 trillion given in the earlier table for all currencies.
Leading to the conclusion that the size of cleared OTC markets in Interest rates is just over 3x the size of ETD markets, using OI as our metric.
Comparing with Futures OI
We could also arguably remove Options from the ETD figures as the equivalent product in OTC is Swaptions which are not cleared but bi-lateral.
In the same vein we should remove Forward Rate Agreements (FRAs) from the OTC figures on the assumption that is post-trade portfolio maintenance to manage rate reset risk in Swaps and there is no need for an equivalent product in ETD space by design.
Let’s do so and show the OI by currency, again as of 30 June 2023.
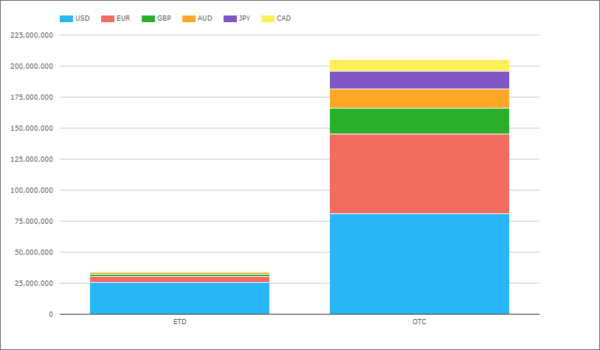 (in USD millions)
- ETD OI of $34 trillion is dominated by USD with $25.7 trillion at CME, while EUR and GBP are much smaller at $4.5 trillion and $2 trillion respectively.
- OTC OI is now $205 trillion, with USD the largest at $81 trillion, followed by EUR at $64 trillion, GBP at $21 trillion, AUD at $15.6 trillion, JPY at $14 trillion and CAD at $9.8 trillion.
Meaning OTC IRD markets are 6X larger than ETD IRD markets.
Interesting how USD ETD OI vs OTC OI at a 1 to 3 ratio is so much larger than the relative ratio of ETD markets in the other six currencies. A testament to the success of CME in the US Interest Rate markets compared to Europe, UK, Australia, Japan and Canada where OTC markets dominate.
Netting vs Compression
One factor contributing to the relatively larger size of OTC OI vs ETD OI, is the lack of position netting in OTC markets. So buys and sells of the same contract in ETD simply net reducing OI, while a pay and receive on a 5Y Swap will not simply net if traded on different days. While post-trade swaps compression does go some way to reducing OI, it is not as efficient as futures contract netting.
Comparing Volumes of Swaps and Futures
While Open Interest is a point in time measure and a key metric for market size, another as important metric is how much volume trades in a period (day/week/month/quarter/year).
For a quick read on these metrics, I recommend the CME Group Education lessons on ‘What is Volume?‘ and ‘Open Interest’.
In CCPView, we can now change our last chart from OI to Volume and do so for the month of June 2023.
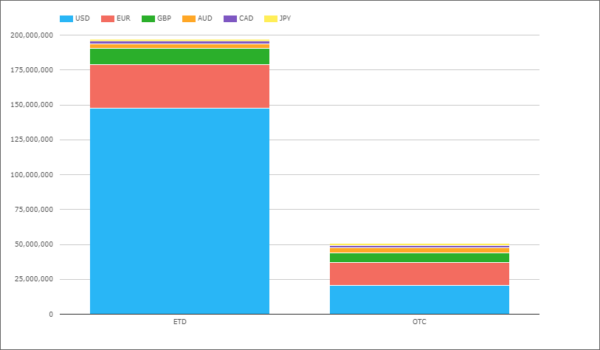 (in USD millions)
Showing that:
- ETD (IR Futures) volume at $197 trillion in the month of June, is far higher than the $50.6 trillion in OTC (IR Swaps), in fact 4X larger.
- USD dominates ETD with $147 trillion (all at CME) followed by EUR at $31.6 trillion (ICE and Eurex) and GBP at $11.2 trillion (ICE).
- While OTC is less dominated by USD, but USD still the largest at $20.9 trillion, followed by EUR at $16.5 trillion and GBP at $6.5 trillion.
Making ETD IRD Volume 4X larger than OTC IRD Volume (in June 2023).
Very different from our prior statement that OTC IRD Open Interest was 6X larger the ETD IRD, as of 30 June 2023.
These two statements intuitively make sense as we know that Futures markets are characterized by a high frequency of trading, many participants, live order books, a lot of intraday trading in smaller size with many participants closing positions at end of day (EOD). While Swap markets are characterized by less frequent trading in larger size by fewer participants with trades staying open for long periods.
(Note in the above chart we could have used Average Daily Volume (ADV) instead of Volume, as well as looking at different months and while this would make the figures smaller and different, the core conclusion would be the same with some variability in the 4X and 6X multiples, possibly up to +/- 1.5).
In summary
Cleared Swaps is a large market.
Volume and Open Interest figures are in trillions.
Interest rates are by far the largest asset class in OTC.
In CCPView we compare IRD markets for OTC and ETD.
Showing OI is larger in OTC and Volume in ETD.
There are a lot more ways to look at the data.
Different periods, products, currencies, asset classes.
Topics for the next blog.