
2024 CCP volumes and share in CRD and FXD
This content was originally published by Clarus.
A review of Credit Derivatives (CRD) and FX Derivatives (FXD) volumes and market share at clearinghouses (CCPs) in 2024.
For CRD, index, single-name, and swaptions:
- In USD, CDX volumes shaded up, with single-name CDS volumes flat.
- In EUR iTraxx, volumes were up, with ICE Clear Credit market share markedly up to 76.5 percent and LCH CDSClear flat at 23.5 percent.
- In EUR single-name CDS, volumes were down, with ICE Clear Credit market share markedly up to 63.9 percent and LCH CDSClear up slightly to 36.1 percent.
For FXD NDF, options, forwards, and spot:
- NDF volumes were up 22 percent, with INR, TWD, KRW, and BRL all over $2 trillion.
- Options volume was up 72 percent, all at LCH ForexClear.
- Options outstanding notional increased to $426 billion.
All the charts and details are from CCPView.
Credit Derivatives volume
First, we look at USD CDX, single-name CDS, and swaptions.
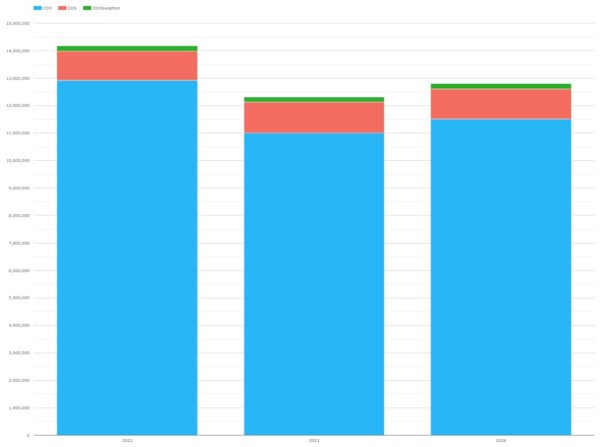
Chart 1 – USD CRD Volumes by product (USD millions)
- CDX 2024 volume of $11.1 trillion, up from 2023 volume of $10.6 trillion, an increase of 4.3 percent.
- Single-name CDS volume was $1.09 trillion, flat from 2023.
- CDXSwaptions volume was $189 billion, up from $174 billion, an increase of 8.9 percent.
- CDX volumes represented 89.9 percent of USD CRD volume, with single-name CDS at 8.6 percent and CDXSwaptions at 1.5 percent.
Now we look at USD market share, starting with CDX.
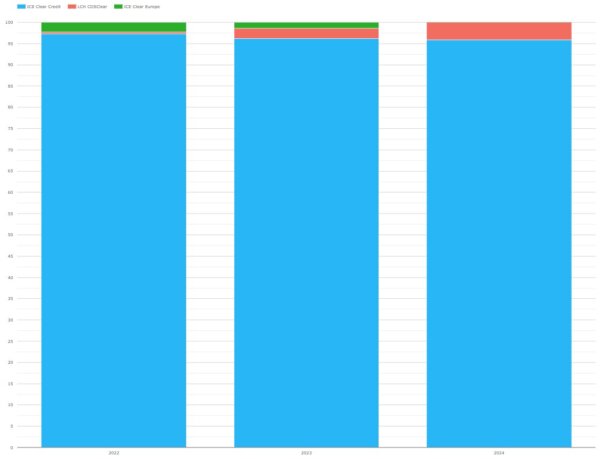
Chart 2 – USD CDX market share of CCPs
- ICE Clear Credit had 95.9 percent of USD CDX in 2024, down from 96.2 percent in 2023.
- LCH CDSClear had 4.1 percent, up from 2.3 percent.
Next, we look at the market share of USD single-name CDS.
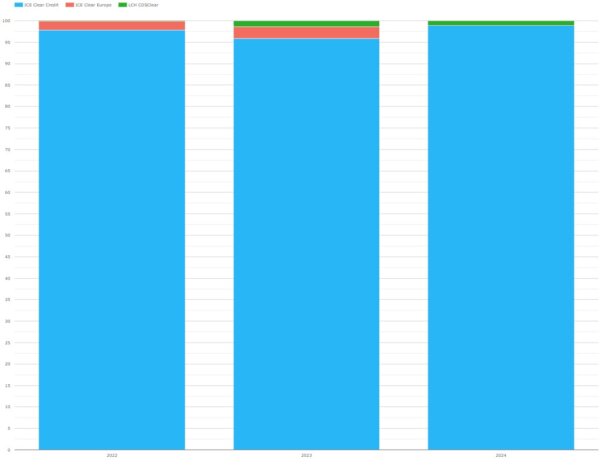
Chart 3 – USD single-name CDS market share of CCPs
- ICE Clear Credit had 98.9 percent of USD single-name CDS in 2024, up from 95.9 percent in 2023.
- LCH CDSClear had 1.1 percent, down from 1.4 percent.
Now, we look at for EUR CRD by product.
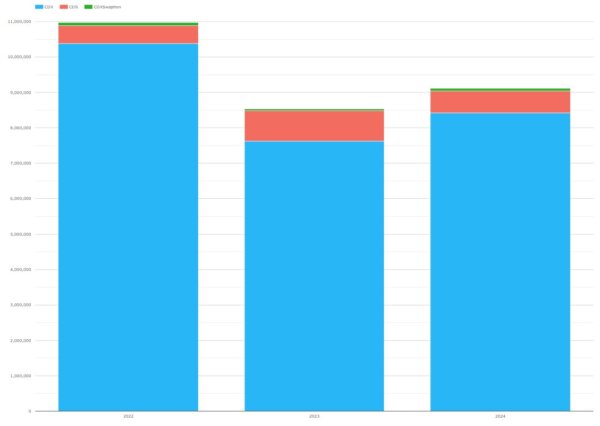
Chart 4 – EUR CRD Volumes by product type (EUR millions)
- iTraxx 2024 volume was €8.4 trillion, up 10 percent from €7.6 trillion in 2023.
- Single-name CDS were €617 billion, down 28 percent from €856 billion.
- iTraxxSwaptions were €77 billion, up 62 percent from €47 billion.
- iTraxx was 92.4 percent of EUR volume, with single-name at 6.8 percent and iTraxxSwaptions at 0.8 percent.
Now, we look at CCP market share, starting with EUR iTraxx.
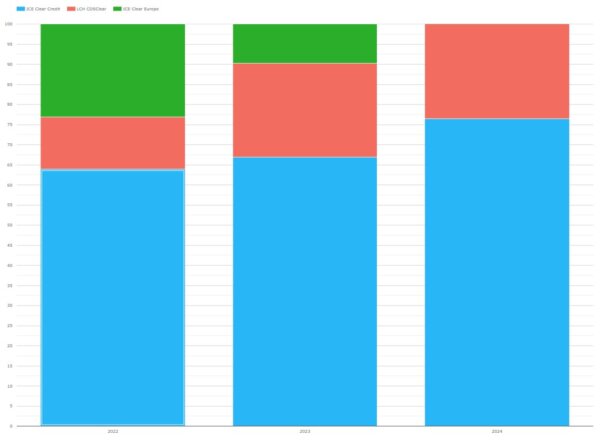
Chart 5 – EUR CRD Index market share of CCPs
- ICE Clear Credit had a 76.5 percent share of EUR iTraxx in 2024, up from 69.9 percent and 63.9 percent in prior years.
- LCH CDSClear had 23.5 percent, up from 23.4 percent and 13 percent.
- ICE Clear Credit picked up most of the iTraxx share of the closing ICE Clear Europe.
Next, we come to CCP market share of EUR single-name CDS.
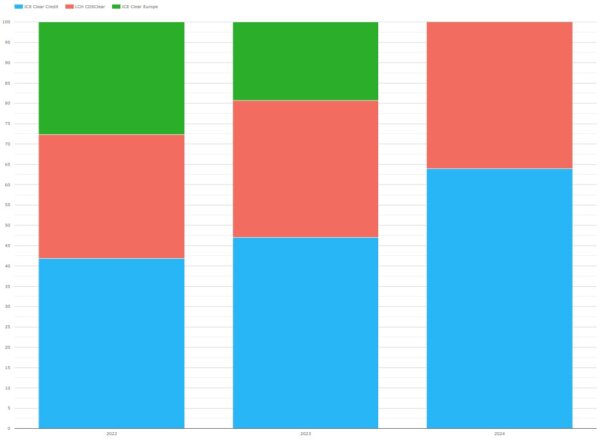
Chart 6 – EUR single-name CDS market share of CCPs
- ICE Clear Credit had 63.9 percent of EUR single-name CDS in 2024, up from 47 percent and 41.8 percent in prior years.
- LCH CDSClear had 36.1 percent, up from 33.8 percent and 30.5 percent.
- ICE Clear Credit picked up more of the residual share of the closing ICE Clear Credit than did LCH CDSClear.
Finally, 2024 EUR iTraxxSwaptions were split 72.1 percent at LCH CDSClear and 27.9 percent at ICE Clear Credit, continuing the trend away from the 99+ percent LCH CDSClear dominance in 2022.
Next, we come to JPY CDX and CDS.
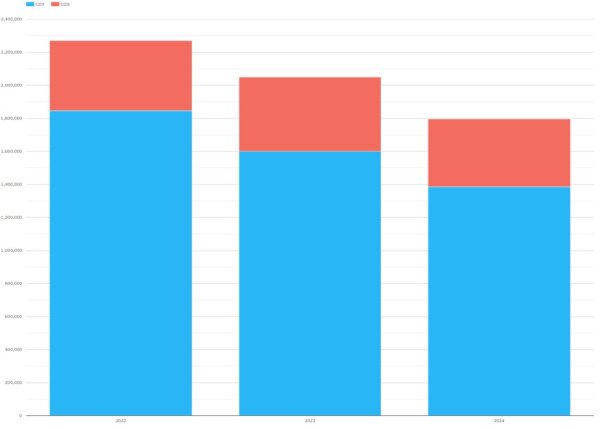
Chart 7 – JPY CRD Volumes by product type (JPY millions)
- JPY CDX volume in 2024 was ¥1.39 trillion, down from ¥1.60 trillion and ¥1.84 trillion in prior years.
- JPY single-name CDS were ¥412 billion, down from ¥451 billion and ¥426 billion.
- All the volume was at JSCC.
FX Derivatives volumes
First, we look at FXD by product type: non-deliverable forwards (NDFs), options, forwards, and spot.
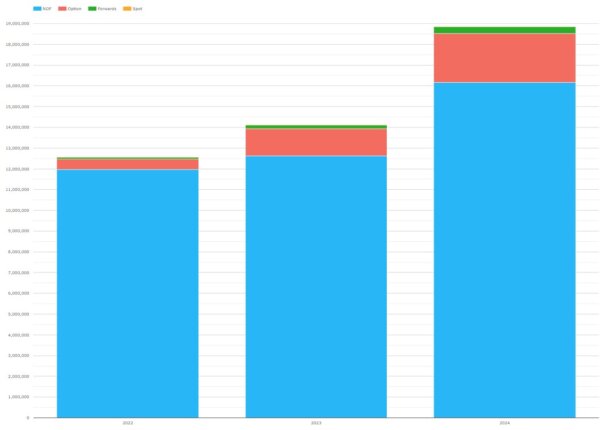
Chart 8 – Cleared FXD Volumes in USD millions
- NDFs were by far the largest with $16.2 trillion in 2024, a 22 percent increase from $12.5 trillion.
- FX Options were $2.36 trillion, up 45 percent from $1.31 trillion.
- Forwards were $136 billion, down from $324 billion.
- Spot was $10.5 billion, up from $4.6 billion.
Next, we view NDF by currency pair.
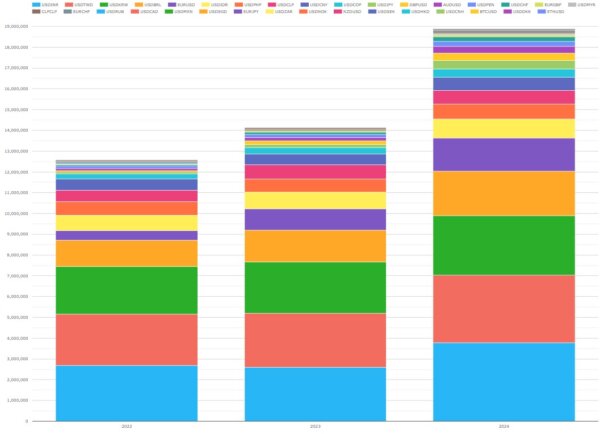
Chart 9 – NDF volumes by currency pair (USD millions)
- INR was the largest in 2024 with $3.77 trillion.
- TWD was next with $3.28 trillion.
- KRW was $2.84 trillion.
- BRL was $2.15 trillion.
- EUR was $1.59 trillion, making up the top 5.
Now, we look at NDF market share by CCP.
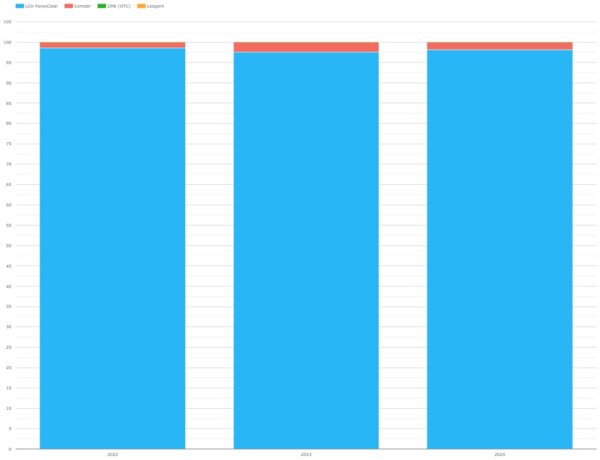
Chart 10 – Cleared NDF volume market share
- LCH ForexClear, with $40.0 trillion held a 98.1 percent share in 2024.
- Comde,r at $759 billion, represented a 1.9 percent share.
- CME OTC, with $23.4 billion, held a 0.1 percent share.
Now, we drill into FX Options by currency pair.
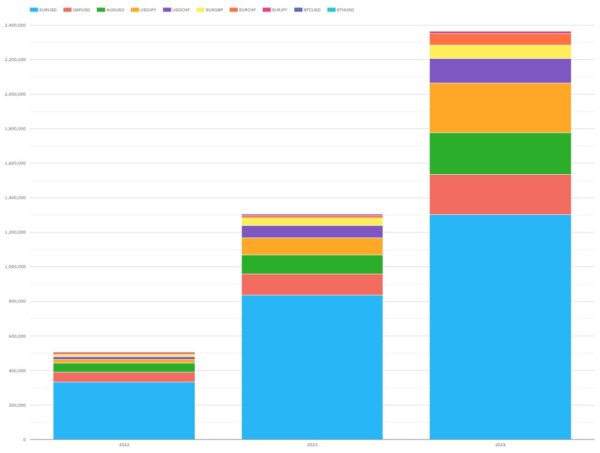
Chart 11 – Cleared FXO volumes in USD millions
All cleared FX options were $2,422 billion in 2024, 72 percent up from 1,413 billion in 2023:
- EURUSD was by far the largest with $1,303 billion, up 56 percent from $835 billion.
- USDJPY was next $286 billion, up 190 percent from $98 billion.
- AUDUSD was next with $241 billion, up 117 percent from $111 billion.
- GBPUSD was next with $233 billion, up 89 percent from $123 billion.
- FX Options volume was all at LCH ForexClear.
And a last chart before we end, the outstanding notional at year-end for each currency pair.
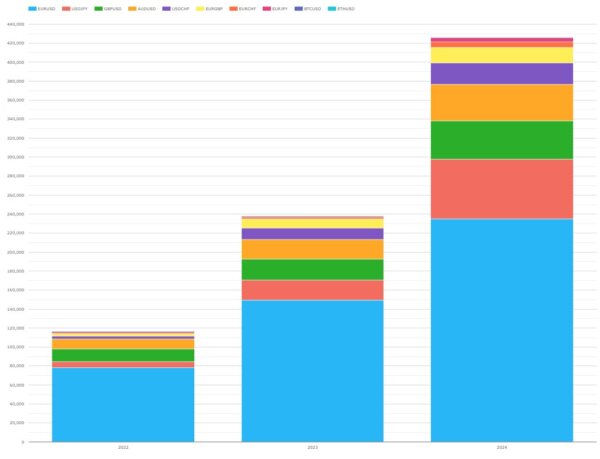
Chart 12 – Cleared FXO outstanding notional in USD millions
- Total Outstanding Notional at the end of 2024 was $426 billion, up 79 percent from $238 billion in 2023.
- EURUSD was the largest with $235 billion, up from $150 billion and $78 billion in prior years.
- USDJPY was next with $62.6 billion, up from $20.9 billion and $6.0 billion.
- GBPUSD was $40.6 billion, up from $21.9 billion and $13.5 billion.
- AUDUSD was $38.5 billion, up from $20.9 billion and $10.9 billion.
That’s It
We used seven charts to cover CRD and five to cover FXD.
There is a lot more data in CCPView:
- Daily, weekly, monthly, quarterly, or annual plots.
- Volume, ADV, Open Interest, OI Change metrics.
- More granular data for CRD at index series or single-name level.
Contact us if you are interested in a subscription.
Stay informed with our FREE newsletter, subscribe here.

Don't miss out
Subscribe to our blog to stay up to date on industry trends and technology innovations.