Swaption volumes by strike – Q2 2025
This content was originally published by Clarus.
This post looks at USD swaptions activity in Q2 as part of our regular quarterly coverage, the most recent of which was Swaption Volumes by Strike – Q1 2024.
We use SDRView data, which shows all trades reported by US financial firms to US SDRs.
If you are new to swaptions, some basics are outlined at the start of the blog linked above.
Swap market context
Q2 2025 saw the following daily price moves and activity in 10-year SOFR swaps:

Chart 1: Q2 2025 USOSFR10 day-by-day notional and VWAP. Source: SDRView
Focusing on the daily volume and volume weighted average price (VWAP) of 10Y USD SOFR Swaps (ticker USOSFR10), Chart 1 shows that there was a 55 basis point (bp) range in the VWAP of 10Y SOFR swaps, from 3.460 percent to 4.011 percent. This is similar to the 58 bp range in Q1 2025. The relatively low day-by-day VWAPs in the first week of April caused 18 bps of this range.
Percentages of trades reported above the capped threshold were in the 8.5 to 9.5 percent range in Q2 0225, continuing the lower level of capping resulting from the increase in block sizes early in Q4 2025.

Chart 2: Month-by-month trade count percentage of USD swaptions above the block threshold. Source: SDRView
Swaptions activity overall
This time I plot month-by-month activity over a longer range to include the prior peak volume month.

Chart 3: Month-by-month USD swaptions executed trade counts by package type. Source: SDRView
Chart 3 shows:
- 24,380+ swaptions were executed in Q2 2025 – up 16 percent YoY, and up 7 percent QoQ.
- April and May 2025 saw 8,649 and 8,396 swaptions executed respectively, both exceeding January 2025 but still below the February 2023 record of 10,426 (as well as below July and August 2023, and September 2024).
- Compressions reached a new record of $85 billion in June 2025. We expect to blog soon about the swaption compressions volumes from rates IM optimization runs.
Swaptions activity by strike
SDR data for all USD swaptions reported in Q1 2025 (including packages) can be used to create the following heatmaps of swaption activity. Table 1 shows payers, receivers, and straddles combined. Then, each type is broken out in turn in an individual heatmap. Each table shows new trade notional volume (in $ millions) of USD swaptions traded in major whole-year tails in 25 bp strike ranges. Expiries are grouped by tail. For example, a 3M10Y (that is, 3-month expiry, 10-year tail) is grouped with a 1Y10Y, if they were traded at the same strike. Red areas show the “hottest” strikes and tails, meaning those with the most notional traded.
First, we look at the summary.

Table 1: USD swaptions notional volumes by major tail and strike in USD millions. Source: SDRView
We see:
- Q2 2025 USD swaption notional volumes in these tails decreased by 3 percent over Q1.
- Strikes all the way up to 6.75 percent were traded in the quarter.
- The 6.25 percent strike continued its higher-than-usual activity, this time focused on 1Y tails (trading over $6 billion) and 10Y and 20Y tails (each trading over $1 billion) instead of Q2’s focus mainly on 10Y tails.
- The red areas clustering around 3.5, 3.75, 4, and 4.25 percent largely reflect where the at-the-money rates were, as volume trading is naturally concentrated around these areas.
- The most active tail was 1Y, with $1,171 billion traded across all strikes, largely driven by $831 billion traded in strikes of 3.5, 3.75, 4, and 4.25 percent.
- Tails with bigger QoQ volume reductions were 1Y – down $233 billion (17 percent), and 2Y – down $44 billion (10 percent), while the bigger QoQ increases were in 5Y – up $52 billion, 10Y – up $64 billion, and 30Y – up $42 billion.
Now, we look at fixed-rate receivers.
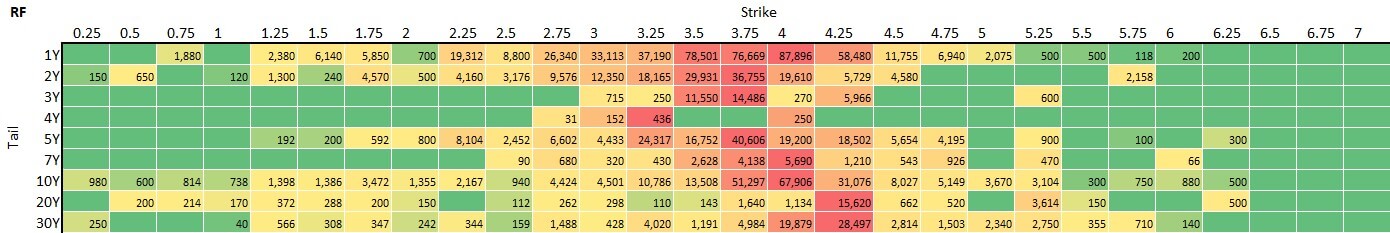
Table 2: USD receiver swaptions notional volumes by major tail and strike in USD millions. Source: SDRView
We see:
- Fixed-rate receiver swaptions accounted for most of the overall QoQ volume decrease, with activity in these tails down 11 percent on Q1.
- Receivers made up 41 percent of overall swaption notional traded – down from 45 percent QoQ.
- The most active tail was 1Y, which saw material activity in a range of strikes, with more than $10 billion traded in the 2.25 strike and each strike from 2.75 to 4.5 percent.
- 20Y tails were again more actively traded in receivers, which were 50 percent of 20Y tails activity versus 35 percent in payers. 20Y tails were highly concentrated in the 4.25 percent strike, which alone was 59 percent of the activity.
Next, we have fixed-rate payers.
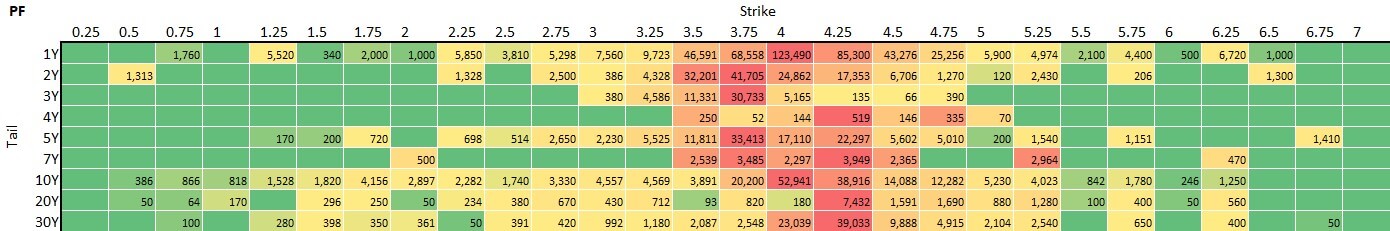
Table 3: USD payer swaptions notional volumes by major tail and strike in USD millions. Source: SDRView
We see:
- Total activity in fixed-rate payer swaptions was up 3.2 percent on Q1.
- Payers made up 39 percent of overall swaption notional traded – up from 36 percent.
- 1Y and 4 percent were the most active tail and strike (compared with 1Y and 4.25 percent in Q1).
- 4Y payers accounted for 64 percent of all activity in 4Y tails.
- 30Y payers continued to be active at 48 percent of total 30Y tails activity (compared with 50 percent in Q4).
Finally, there are straddles.

Table 4: USD swaption straddles notional volumes by major tail and strike in USD millions. Source: SDRView
We see:
- To briefly reiterate from earlier blogs, the range of strikes is more compressed for straddles, because they more closely follow at-the-money rates. This is because, if rates do not really move, payer and receiver positions both expire worthless, making the premium paid (or received) a loss (or gain).
- Total activity in swaption straddles was up 3.8 percent on Q1.
- Straddles made up 20 percent of overall swaption notional traded – up from 19 percent.
- The most traded straddles were 1Y tails at 3.5 and 3.75 percent strikes; then 10Y at 4 percent and 4.25 percent. The 1Y tail alone accounted for over $244 billion or 43 percent of straddle activity.
In summary
- Q2 2025 USD swaptions activity volume was roughly flat QoQ (down 3 percent) with lower Q2 volume mainly in 1Y and 2Y tails offset by Q2 volume increases mainly in 5Y, 10Y, and 30Y tails.
- The activity heatmaps show what can be done with SDRView trade data to show the most active USD swaption tails and strikes.
- After a quieter quarter, we wonder what Q3 holds.
Please contact us if you are interested in an SDRview subscription.
Stay informed with our FREE newsletter, subscribe here.

Don't miss out
Subscribe to our blog to stay up to date on industry trends and technology innovations.